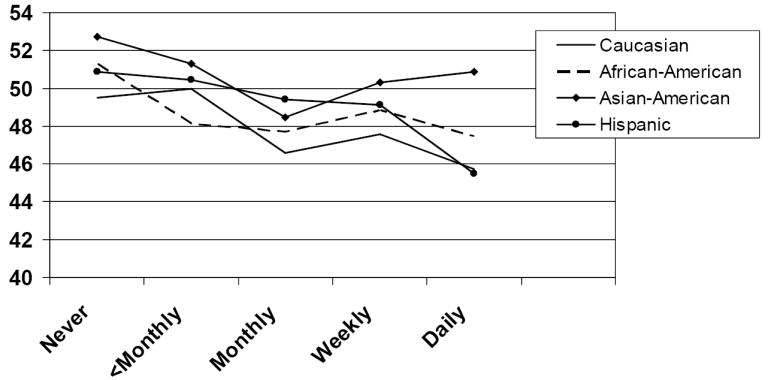
Figure 5. Adjusted* mean mental component summary scores for incontinence frequency by race.

*Adjusted for age, body mass index, income and Charlson comorbidity score. Higher SF-36 scores indicate higher quality of life.

*Adjusted for age, body mass index, income and Charlson comorbidity score. Higher SF-36 scores indicate higher quality of life.