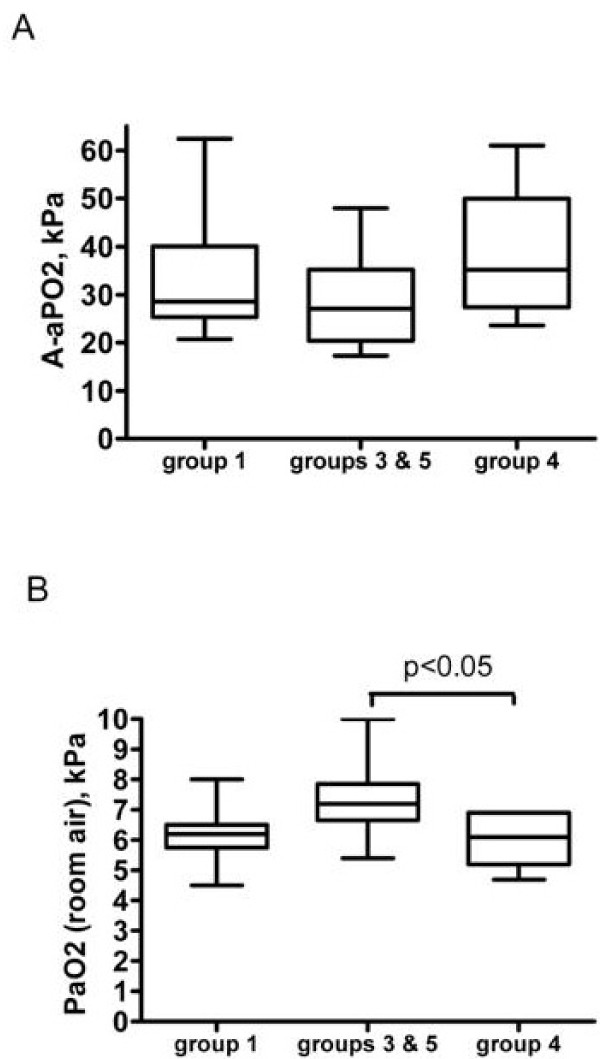
Figure 2.
A, Measurement of AaPO2 while breathing 100% oxygen according to the etiologic groups of patients (difference between groups was not significant by oneway analysis of variance). B, PaO2 on room air according to the etiologic groups (difference between groups was significant by Kruskal Wallis analysis, with p < 0.05; two-by-two post-hoc analysis was significant between groups 3 and 5, and group 4 by Bonferroni's multiple comparison test, p < 0.05). Group 1, pulmonary arterial hypertension; group 3, pulmonary hypertension associated with pulmonary diseases; group 4, chronic thromboembolic pulmonary hypertension; group 5, miscellaneous.

