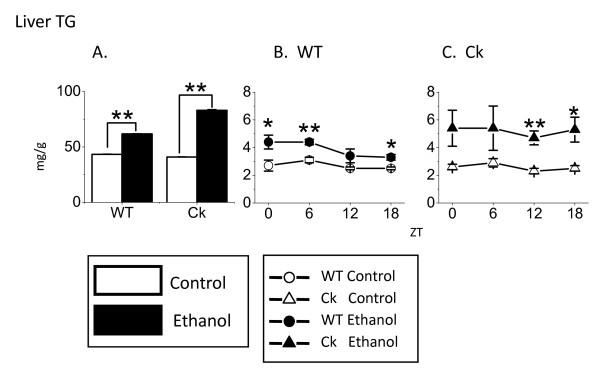
Figure 2.
Chronic ethanol increases liver triglycerides (TG) content in Clock-mutant mice. (A) Ethanol exposure significantly increased the TG levels in both WT (n = 16) and Ck (n = 16) mice. Further analysis by two-way ANOVA indicates that the ethanol-induced increase was greater in the mutant mice (P < 0.01). (B) In WT mice, ethanol exposure significantly increased liver TG at ZT 0, 6, and 18 (n = 4 for each time point). (C) In Ck mice, ethanol exposure significantly increased liver TG at ZT 12 and 18 (n = 4 for each time point). Values are means ± SEM. Significance was initially determined using the one-way ANOVA followed by Fischer PLSD (*P < 0.05, **P < 0.01).

