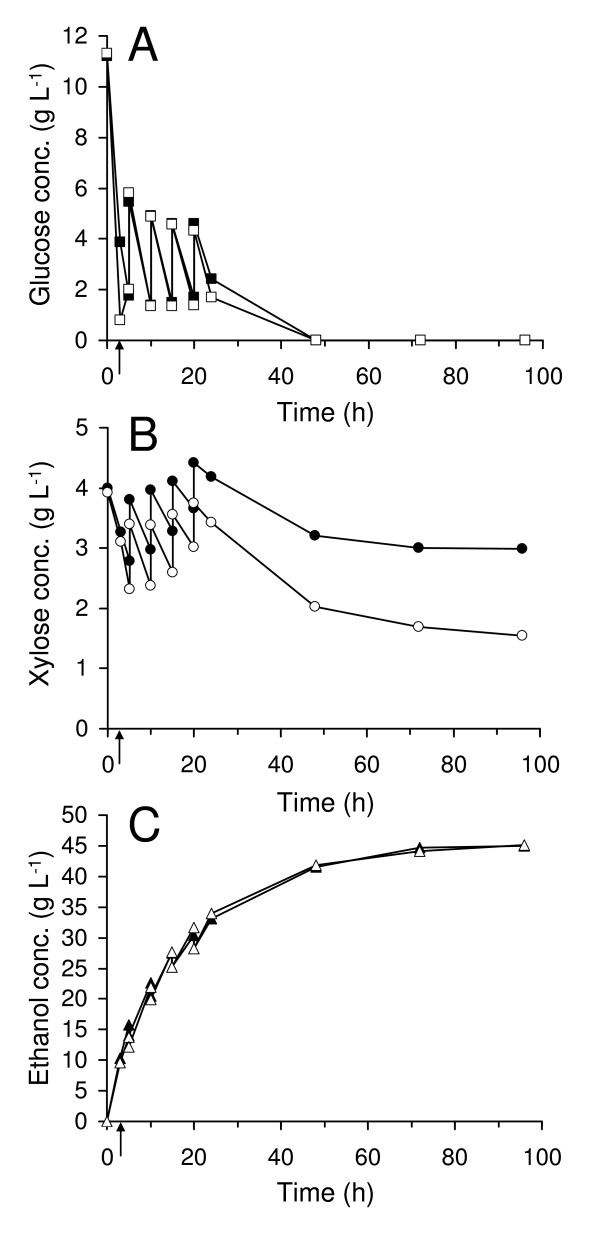
Figure 3.
Measured concentrations in fed-batch SSF at 10% WIS. Glucose concentration (A), xylose concentration (B) and ethanol concentration (C). Filled symbols represent experiment without prefermentation and unfilled symbols represent experiment with prefermentation. The time of enzyme addition, in the case of prefermentation, is marked with an arrow.

