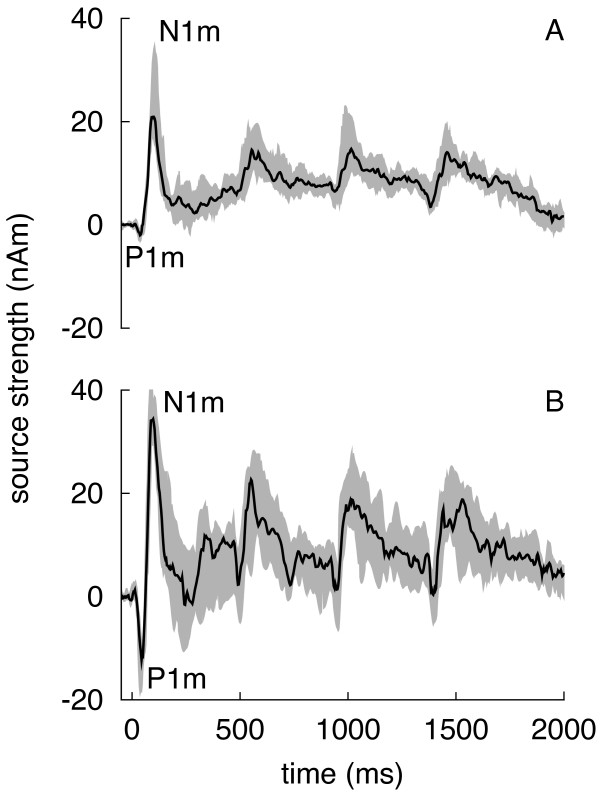
Figure 1.
Averaged AEF waveforms. Averaged auditory evoked magnetic fields in 14 younger (A, age range: 20 – 27 years) and 9 older adults (B, age range: 60 – 78 years). The first P1m and N1m responses are marked. The black waveforms represent the median and the grey area the upper and lower 95% nonparametric bootstrapped confidence intervals.

