Figure 4.
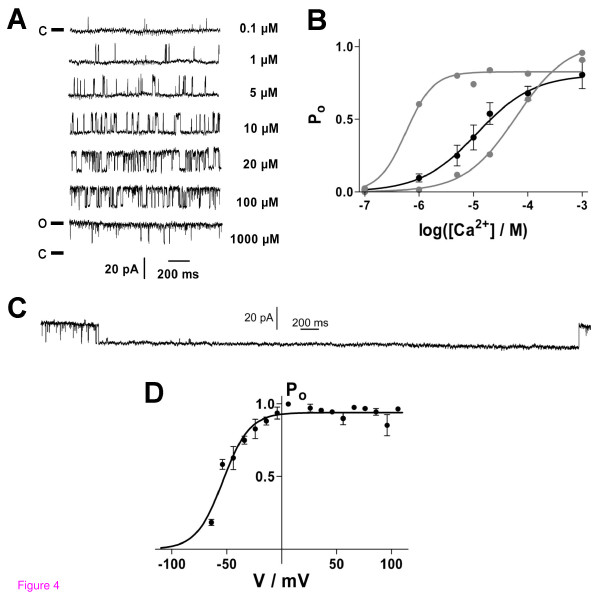
Electrophysiological characterization of Ca2+- and voltage-dependence of BKCa channels in human GCs (inside-out recordings). (A) BKCa current traces recorded at +60 mV and varying [Ca2+]i (right). The closed channel state (c) corresponds to the respective lower current level (o, open state). (B) Ca2+-dependence of the channel open probability, Po, at +70 mV. Data (black circles) represent means ± SEM of recordings from 30 cells and were fitted by a sigmoidal dose-response function with the bottom value fixed to be 0. EC50 = 12 μM, Hill-slope = +0.8 μM (n = 30). Gray circles and fit curves show data from two individual recordings that represent extrema of Ca2+-dependence of Po. (C) BKCa channel inactivation at [Ca2+]i = 1 mM and +70 mV. (D) Voltage-dependence of Po at [Ca2+]i = 1 mM (V50 = -54 mV, n = 4). Data were fitted by a Boltzmann sigmoidal function with bottom value fixed to be 0.

