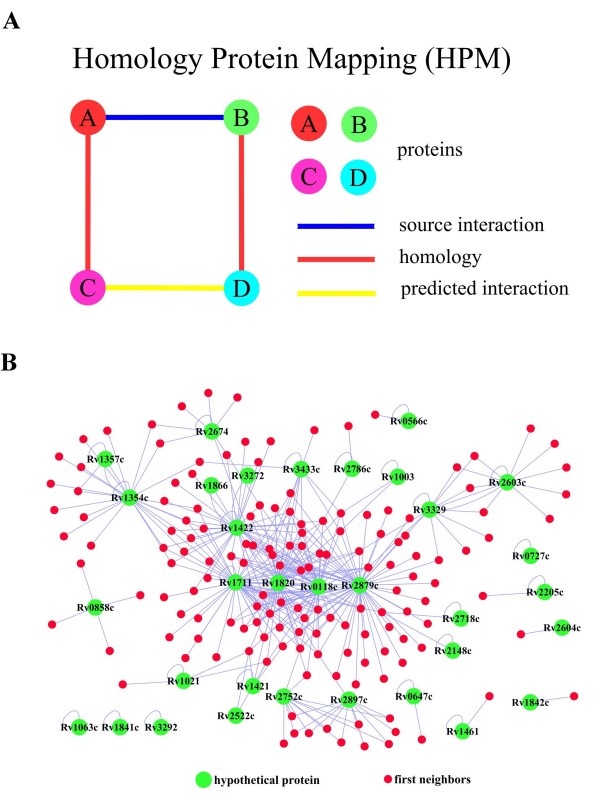
Figure 1.
(A) Schematic diagram of the homologous protein mapping (HPM) method. Two proteins are predicted to have functional linkage (linked with the yellow line) if they have higher homology (linked with the red line) with a pair of interactive proteins that have been validated experimentally (linked with the blue line). Circles represent different proteins. (B) A local PPI network of hypothetical proteins. Thirty-three proteins (green dots) that were annotated as hypothetical proteins in genome annotation appeared in the predictive protein interaction network generated in this study (see Additional file 3).

