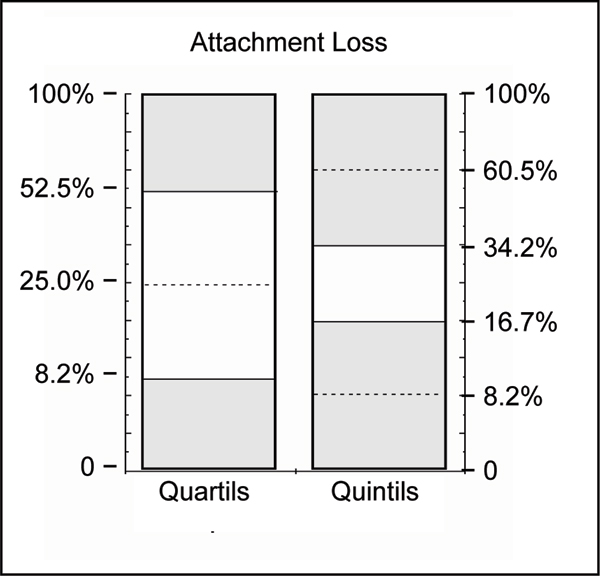
Figure 2.
Illustration of separation criteria between periodontally 'diseased' and 'healthy' subjects, indicated by the shaded areas. Quantils to dichotomize the continuous variable % attachment loss into 'cases' (upper quantils) versus 'controls' lower quantils. Numbers on the ordinate give the cut-offs as attachment loss ≥ 4 mm in percent of the sites measured.

