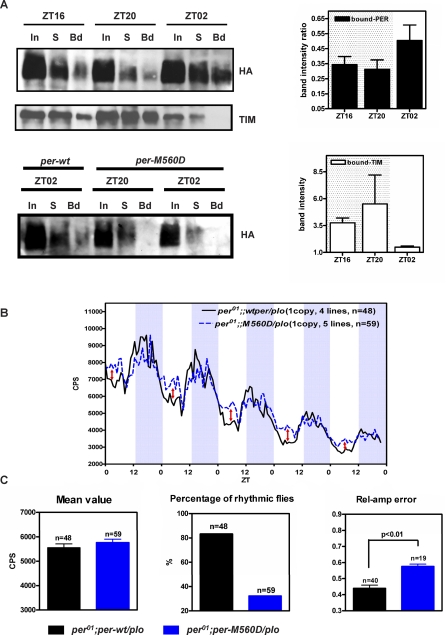
Figure 5. The PER:PER Dimer Is Important for PER Repressor Activity.
(A) Temporal profile of PER:PER and PER:TIM dimer formation at three different time points at 25 °C was analyzed by CoIP (see legend to Figure 3 and Materials and Methods for details). Three independent experiments were performed. “Band intensity ratio” indicates the relative amount of PER homodimers. It represents the ratio between the HA signals in the “Bd” fraction and that in the “In” fraction. For TIM, band intensities where averaged. At ZT2 significant more PER:PER dimers are formed compared to ZT16 and ZT20.
(B) Transcriptional rhythms of per expression were measured in vivo using the real-time luciferase measurements in adult flies of the plo transgenic type in a per01 genetic background (Materials and Methods). An average of four per-wild-type transgenics (both HA and c-MYC tagged) shows clear rescue of rhythmic plo expression (usually expression of this construct is arrhythmic in a per01 genetic background [56,57]). In contrast the M560D mutant results in severely dampened transcriptional per rhythms (blue line) and less-pronounced trough levels of plo expression, indicating faulty repressor activity mediated by the M560D PER.
(C) Quantification of expressions levels (left) and determination of the significance of rhythmicity for each time series by FFT-NLLS analysis. M560D drastically reduces rhythmicity (middle) and the few rhythmic flies show significantly increased rel-amp errors, indicative of weak rhythmicity (Material and Methods).

