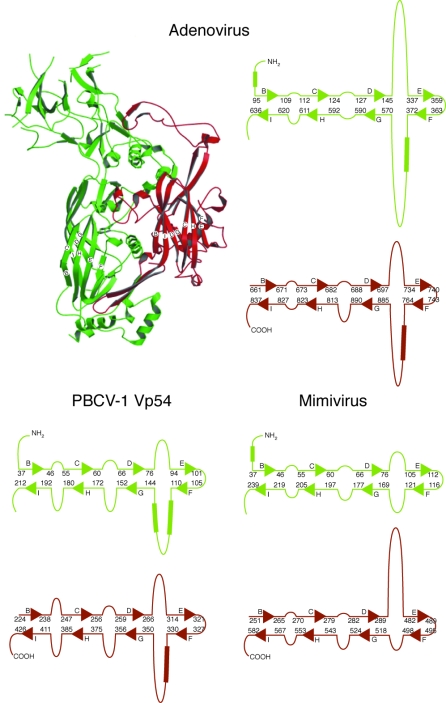
Figure 1. Comparison of Virus MCPs.
The N-terminal and C-terminal jelly-roll domains are colored green and red, respectively. Top left is a ribbon diagram of the adenovirus capsid protein. Diagrammatic representation of the arrangement of the β strands (arrows) within each jelly-roll are given for adenovirus, PBCV1, and Mimivirus at the top right, bottom left, and bottom right, respectively. The β strands within each domain are labelled A to H. This gives rise to the two opposing BIDG and CHEF β sheets in each jelly-roll as indicated in the ribbon diagram. Occasional α helices are represented as bars.

