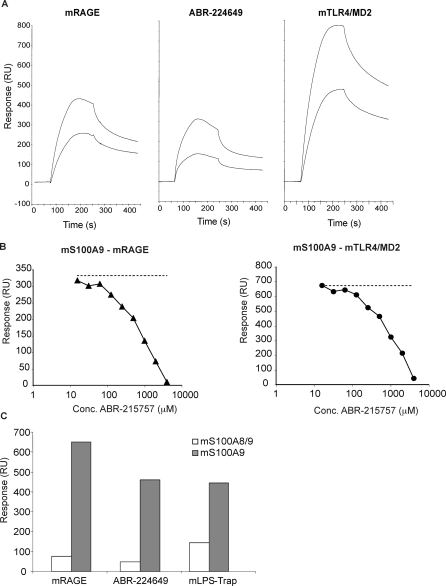
Figure 4. Analysis of Mouse S100A9 Interaction with Mouse RAGE, Q Compound, and Mouse TLR4/MD2.
(A) Sensorgrams generated after injection of 50 and 100 nM mouse S100A9 (3 min at 30 μl/min) over indicated ligands coupled to the sensor chip.
(B) Inhibition curves for displacement of 100 nM mouse S100A9 interacting with mouse RAGE and mLPS-Trap, respectively, using ABR-215757 as competitor. Conc, concentration.
(C) Binding of 100 nM mouse S100A9 homodimers and S100A8/A9 heterodimers to the indicated surfaces.

