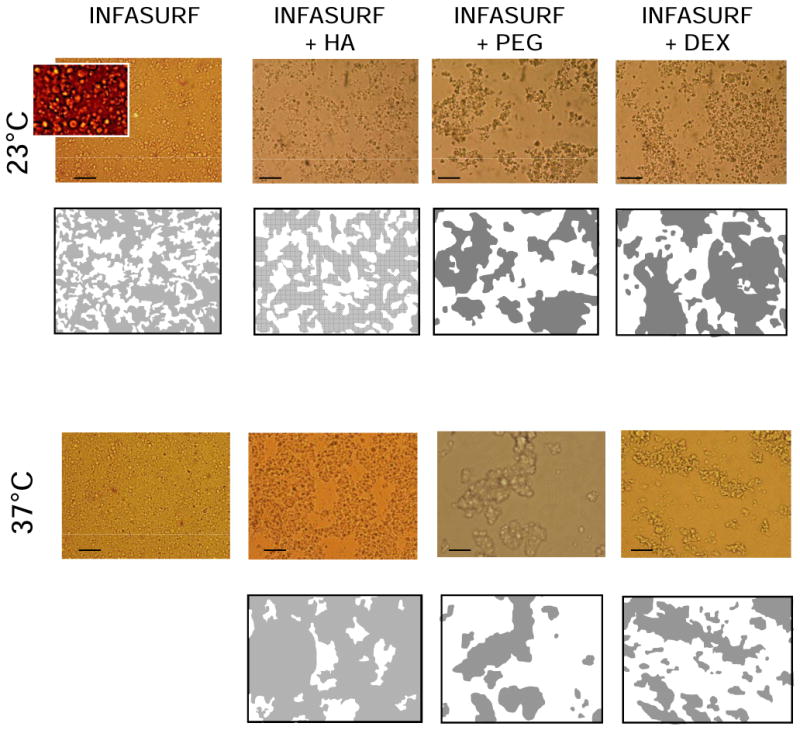
Figure 4. Microstructure of Infasurf in the absence and presence of polymers.

Micrographs of Infasurf suspensions at 35mg/mL, in the absence or presence of dextran 5%, PEG 5% or HA 0.25% preincubated at 23°C (upper pictures) or 37°C (lower pictures). Slides were taken under an optical microscope as described in Methods with scale bars representing 20 μm. Insert in the Infasurf picture was magnified an additional three times and contrast-enhanced to illustrate the aggregate structure of this surfactant. Below the micrographs are two dimensional maps representing the projection of the apparent volume occupied by either surfactant aggregates (grey) or free liquid (white).
