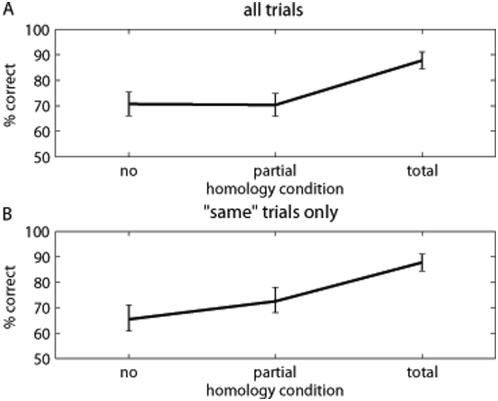
Figure 3. Mean percentage of correct responses for Experiment 1.
Vertical bars indicate standard error of the mean. A Effect of homology over all trials (i.e. both ‘same’ and ‘different’ responses; with total homology, however, correct responses were always ‘same’). B Effect of homology for ‘same’ trials only.

