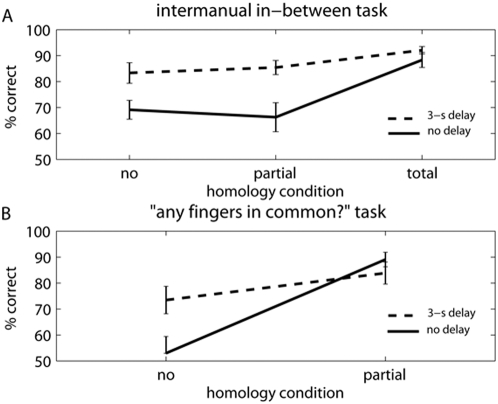
Figure 5. Mean percentage of correct responses for Experiment 2.
Vertical bars indicate standard error of the mean. Continuous lines indicate trials in which touches were given simultaneously on both hands, dotted lines indicate trials in which a 3-s offset was present between touches on the two hands. A Effect of homology in the in-between task. B Effect of homology in the ‘any fingers in common?’ task.

