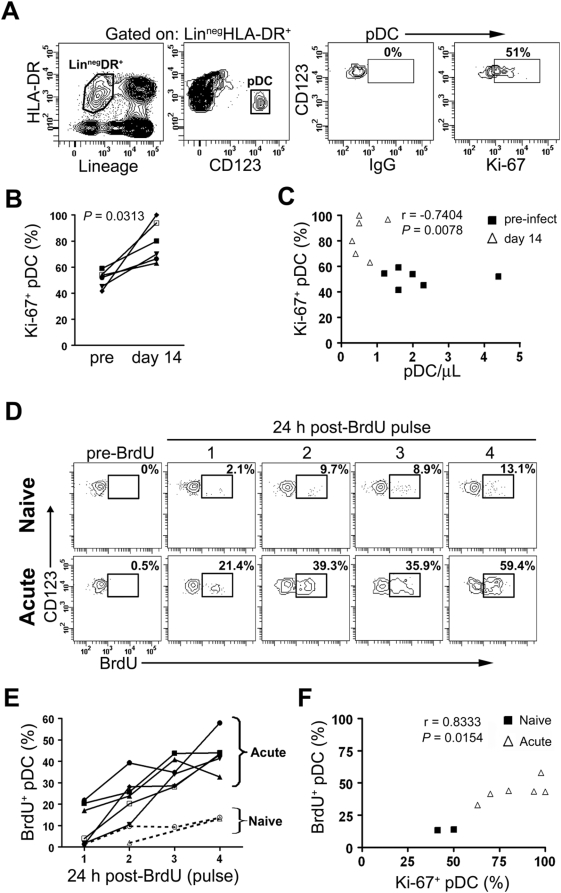
Figure 3. Rapid mobilization of pDC into blood during acute SIV infection.
(A) Representative contour plots from an animal prior to infection demonstrating the gating strategy used to identify Ki-67+ pDC in blood. pDC were gated as in Figure 1 and Ki-67 positivity determined based on the level of background fluorescence using the isotype-matched control Ab. Numbers represent the percentage of cells within the indicated gates. (B) Paired analysis of percentage of Ki-67+ pDC in blood prior to infection and at day 14 after infection. Symbols represent individual animals. (C) The absolute number of pDC in blood was inversely correlated with the percentage of cells expressing Ki-67. Shown are data from individual animals prior to infection and 14 days after infection. (D) Representative contour plots demonstrating the gating strategy used to identify BrdU+ pDC prior to and 24-hours after four consecutive intravenous daily injections of BrdU in an SIV-naive and SIV-infected macaque. BrdU was delivered starting on day 10 of infection. Numbers represent the percentage of BrdU+ pDC within each gate. (E) The percent of BrdU+ pDC in blood of SIV-naïve animals (dashed lines) and SIV-infected animals (solid lines) 24 hours after each BrdU pulse. (F) The percent of BrdU+ pDC was positively correlated with the percent of Ki-67+ pDC 24 hours after the final BrdU administration.

