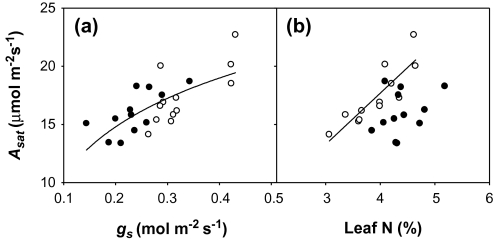
Fig. 2.
(a) Relationship between Asat and gs, y=21.3(1–e–6.03x); r=0.76, P <0.0001. (b) Relationship between Asat and leaf N; low N treatment, y=3.74xLN–2.68; r=0.66, P <0.01. Open and filled circles represent, respectively, the low and high N treatment means for each genotype and water condition. Each value is the mean of four replicates.

