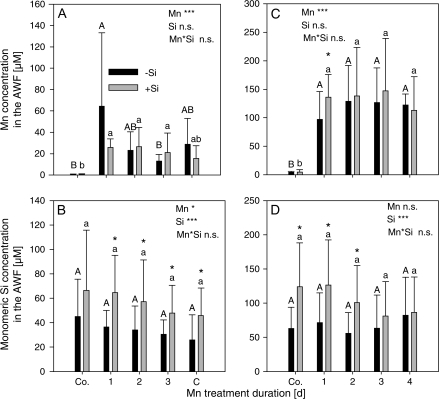
Fig. 2.
Effect of Mn treatment duration and Si supply on the Mn concentration (A, C) and the monomeric Si concentration (B, D) in the water-soluble apoplastic fraction (A, B), and in the ionically bound apoplastic fraction (C, D) of the second oldest trifoliate leaves of the Mn-sensitive cowpea cultivar TVu 91. After 2 weeks of preculture at 0.2 μM Mn, the Mn supply was increased to 50 μM for 4 d. Silicon was supplied throughout plant culture. Results of the analysis of variance are given according to their level of significance as ***, **or * for P <0.001, 0.01, or 0.05, respectively. Upper case and lower case letters indicate significant differences between Mn treatment duration of –Si and +Si-treated plants, respectively, at P <0.05. An asterisk on top of the columns indicates siginificant differences between the Si treatments for at least P <0.05 according to Tukey. Values are means ±SD with n=16.

