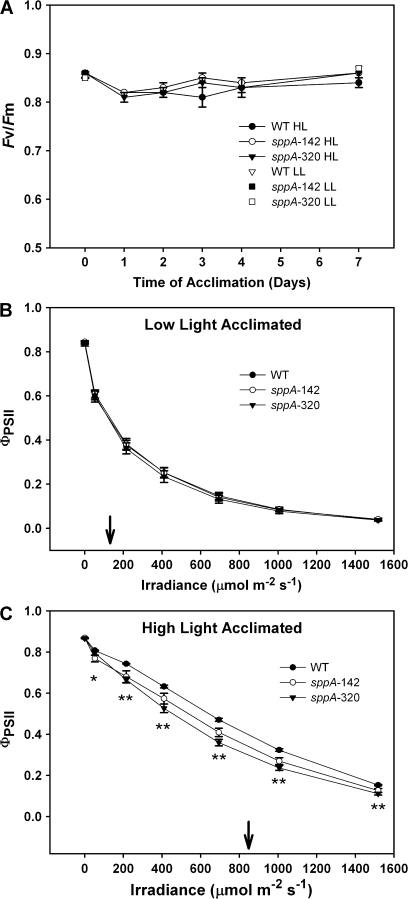
Fig. 5.
Pulse-modulated chlorophyll fluorescence measurements of quantum yield of Photosystem II. (A) Dark-adapted maximal quantum yield of Photosystem II (Fv/Fm) versus time of acclimation for HL plants. Included are the Fv/Fm values for day 0 and day 7 for LL plants. (B) The quantum yield of Photosystem II [ΦPSII; ] versus irradiance of LL acclimated plants. (C) The quantum yield of Photosystem II [ΦPSII; ] versus irradiance of HL acclimated plants. Pairwise t test results are indicated by: * (WT >sppA-142 but not sppA-320), or ** (WT > sppA-142 and sppA-320); see Results for details. In (B) and (C) the arrow indicates the acclimation light level. N=7–14 per genotype, and the error bars are standard errors of the means.

