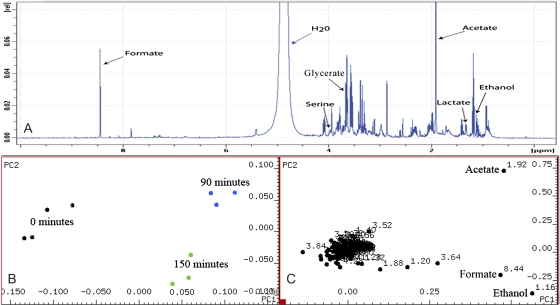
Fig. 2.
(A) NMR spectrum obtained from a sample at the end of the dark anaerobic adaptation period showing some identified metabolites. (B) Scores plot showing sample points separate into distinct groupings along principal components 1 and 2. (C) Loadings plot from assay revealing the key components leading to variance throughout the assay along principal components 1 and 2 to be ethanol, acetate, and formate. Four biological replicates were taken for analysis at the three timepoints. However, baseline distortion during spectral analysis resulted in the omission of one sample from the latter two timepoints. (This figure is available in colour at JXB online.)

