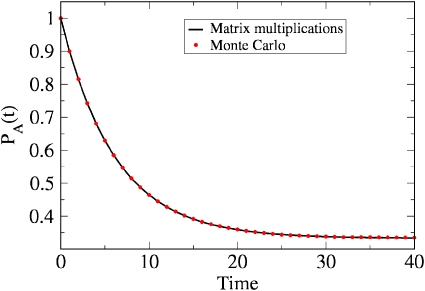
Figure 3.
Time evolution of population probability PA(t) as obtained from Eq. 2.7, starting from state A and assuming transition probabilities γba=ka=1∕10 and γab=kb=1∕20 for illustration. The system relaxes with a decay rate of γab+γab=3∕20 and approaches equilibrium, PA(∞)=1−⟨NB⟩eq∕N=γab∕(γba+γab)=1∕3, as expected. Also shown is the result of a dynamical Monte Carlo simulation (dotted line), which agrees well with the matrix multiplication method (solid line), when 106 trajectories are employed.

