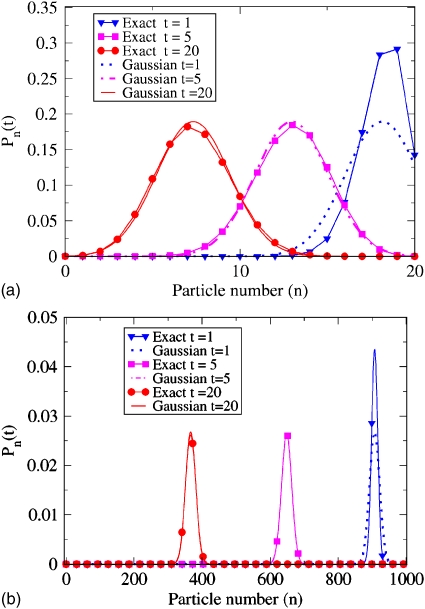
Figure 5.
Time evolution of probability distribution Pn(t) of number of particles, n, in state A, assuming ka=1∕10, kb=1∕20, and initial condition Pn(0)=δn,M. For various times, the exact binomial distribution is shown in solid lines along with the Gaussian distribution drawn with broken lines. In the upper panel M=20 total particles are considered, in the lower M=1000.

