Abstract
Reaching the native states of small proteins, a necessary step towards a comprehensive understanding of the folding mechanisms, has remained a tremendous challenge to ab initio protein folding simulations despite the extensive effort. In this work, the folding process of the B domain of protein A (BdpA) has been simulated by both conventional and replica exchange molecular dynamics using AMBER FF03 all-atom force field. Started from an extended chain, a total of 40 conventional (each to 1.0 μs) and two sets of replica exchange (each to 200.0 ns per replica) molecular dynamics simulations were performed with different generalized-Born solvation models and temperature control schemes. The improvements in both the force field and solvent model allowed successful simulations of the folding process to the native state as demonstrated by the 0.80 Å Cα root mean square deviation (RMSD) of the best folded structure. The most populated conformation was the native folded structure with a high population. This was a significant improvement over the 2.8 Å Cα RMSD of the best nativelike structures from previous ab initio folding studies on BdpA. To the best of our knowledge, our results demonstrate, for the first time, that ab initio simulations can reach the native state of BdpA. Consistent with experimental observations, including Φ-value analyses, formation of helix II∕III hairpin was a crucial step that provides a template upon which helix I could form and the folding process could complete. Early formation of helix III was observed which is consistent with the experimental results of higher residual helical content of isolated helix III among the three helices. The calculated temperature-dependent profile and the melting temperature were in close agreement with the experimental results. The simulations further revealed that phenylalanine 31 may play critical to achieve the correct packing of the three helices which is consistent with the experimental observation. In addition to the mechanistic studies, an ab initio structure prediction was also conducted based on both the physical energy and a statistical potential. Based on the lowest physical energy, the predicted structure was 2.0 Å Cα RMSD away from the experimentally determined structure.
INTRODUCTION
Understanding the protein folding mechanisms has both intellectual interests and practical applications. An enhanced understanding of how proteins fold to their native state may help to improve the accuracy in protein structure prediction. Protein misfolding has also been implicated in a number of human diseases.1 There are two major aspects in the protein folding problem: Kinetics and thermodynamics. The kinetic aspect concerns the pathway and folding∕unfolding rates, i.e., how proteins reach the native states and how fast the processes are. The thermodynamic aspect concerns the equilibrium properties of the protein at different environmental conditions (temperature, denaturant concentration, etc.). In this study, we combine the conventional and replica exchange all-atom molecular dynamics simulations to investigate both the kinetic and thermodynamic aspects of the folding of the B domain of staphylococcal protein A.
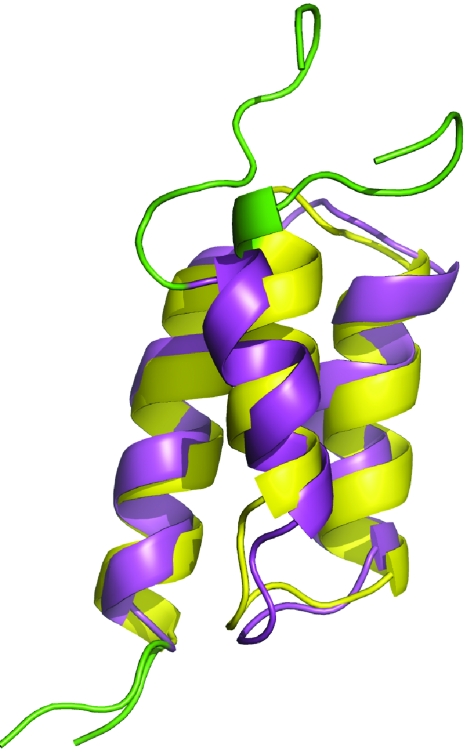
Staphylococcal protein A is an immunoglobulin binding protein; the extracellular portion of which contains a tandem of five domains (designated as A–E domains) with similar sequences and structures. The B domain of protein A (BdpA) consists of 60 residues that forms a three helix bundle and has been a prototypical system to study protein folding due to the robust and fast folding. The structure was first solved at 2.8 Å resolution by x-ray crystallography in complex with immunoglobulin2 in which helices I and II formed the binding surface and helix III was unstructured. Later in a medium resolution nuclear magnetic resonance (NMR) determination of the free B domain in solution3 a well formed helix III was observed. In this NMR study, the helical boundaries were determined as Gln10-His19, Glu25-Asp37, and Ser42-Ala55, and a tilt angle of ∼30° for helix I was observed. Later in a high resolution NMR study of the A2V∕G30A double mutant of B domain (also called the Z domain), helix I was in a nearly perfect antiparallel alignment (Fig. 1).4, 5
Figure 1.
Structure comparison of the natural B domain (magenta, PDB code 1BDC, first model) and its A2V∕G30A double mutant (Z domain, yellow, PDB code 1Q2N, first model) of protein A. The unstructured regions (residues 1–9 and 57–60) are shown in green color. The overall Cα RMSD between these two structures is 1.7 Å for residues 10–56 and the major difference is the tilt angle of the first helix.
In order to unveil the folding mechanism of protein A, a series of experimental studies have been conducted. In the unfolding experiments, protein A unfolds from helix I that was followed by the simultaneous unfolding of helices II and III.6 The truncated protein lacking helix III displayed lower stability and weaker binding.6 The isolated helix III was helical but the isolated helices I and II alone were unstructured. Although the peptide fragment lacking helix I demonstrated marginal stability, the experiments with equipment dead time of 6 ms7 failed to detect this helix II∕III hairpin folding intermediate. This was not surprising given the later revelation that this protein folds at a notably faster rate than the millisecond-scale measurement. More recently, a two-state folding was observed in a temperature-jump experiment with the folding rates of 120 000 s−1 for the wild type and 249 000 s−1 for the F14W∕G30A double mutant.8, 9, 10 However, a biexponential fitting of the (infrared) IR signal gave two rate constants (90 ns and 9 μs),9 hinting the formation of an intermediate state. Later, by monitoring W14 fluorescence, it was concluded that helix II∕III hairpin was formed but helix I was not formed in the intermediate state.11 In a recent detailed Φ analysis, Sato et al.12 systematically measured the folding free energy and folding rate changes due to Ala∕Gly mutations of essentially all core residues (residues 11–55). This systematic survey showed that helix II was fully formed in the transition state along with the N-terminal part of helix III and helix I was essentially unstructured but some native tertiary contacts with helix II were already formed.
Complementary to the experimental effort, due to the moderate size and fast folding, protein A has also received sustained interest from the theoretical community.13, 14 Lucas et al.15 recently developed a dynamic programming approach and studied the helix-bundle folding and cooperativity. Earlier, Zhou and co-workers conducted a series of kinetic studies using off-lattice and all-atom Go-models.16, 17, 18, 19, 20 It was demonstrated that the variation of the artificial energy gap between the native and non-native contacts could lead to different folding mechanism. The all-atom Go-model provided a detailed picture of the folding process, including the high stability of helix III and helix II∕III segments. In another study with an off-lattice Go-model by Berriz and Shakhnovich, a three-state folding was observed with helix II∕III hairpin as the folding intermediate, and formation of the hinges was the energy barriers.21 The unfolding simulations by Alonso and Daggett concluded that helix I was the least stable among the three helices and helix III was the most stable.22 Through a set of unfolding simulations and umbrella sampling, Boczko and Brooks and Guo et al. showed that the free energy landscape of protein A resembles a protein folding funnel that “guides” the protein toward its native state.23, 24 In a more recent work, Garcia and Onuchic25 further studied the thermodynamics of protein A by replica exchange molecular dynamics with explicit solvent starting from a set of configurations of mixed folded and unfolded structures. The simulations revealed two minima in the native basin:25 A “dry” folded state with Q>0.8 (Q is the fraction of the native contacts) and Cα root mean square deviation (RMSD) <2.0 Å and a “hydrated” folded state with 0.3<Q<0.8 and Cα RMSD <4.0 Å.
In the past a few years, attempts have also been made to fold BdpA ab initio, starting from the fully unfolded structures. Several ab initio folding simulations of the truncated BdpA with all-atom physics-based models have produced encouraging results and many of these simulations reached nativelike states that resemble the native state topology. Using a combined electrostatically driven Monte Carlo and energy minimization method, Vila et al.26 were able to sample a structure that has Cα RMSD of 2.85 Å from the NMR structure whereas the lowest energy structure was 3.35 Å. Jang et al.27 performed a set of molecular dynamics simulations and transiently reached a structure with a Cα RMSD of 2.9 Å. They observed fast and stable formation of helix III and a rather broad native basin. We also reported a set of ab initio folding simulations which achieved transient folding to 2.8 Å Cα RMSD.28 We observed slow formation of helix II (Ref. 28) which is consistent with the observations by Jagielska and Scheraga29 in a recent work of a set of 20 ns simulations. Although the ensemble of the most populated conformations was not presented in these reports, the Cα RMSD of the representative structures were likely greater than 4.0 Å. In short, although reaching the nativelike states, as Jang et al. stated,27 has been quite encouraging, the previously reported ab initio folding simulations of BdpA have all failed to sample the native state as judged by the fact that none of the simulations reached a Cα RMSD below 2.8 Å. Because of the lack of sampling to the native state, these simulations have been unable to provide direct information on the processes of reaching the native state.
Here in this study, we applied AMBER FF03 all-atom force field30 and two generalized-Born (GB) solvation models31, 32 to study the folding of BpdA with both Berendsen et al.33 and Andersen34 thermostats. We chose the G30A mutant instead of the wild type because of the enhanced folding rate. Since we chose the G30A mutant in all simulations, the NMR structure of the Z domain, which is the A2V∕G30A double mutant, was used as the reference structure to monitor the folding.5 The other mutation A2V in the Z domain of protein A is expected to have minimal effect on the structure because it is located in the unstructured N-terminal region (residues 1–9). To be more consistent with the kinetic experiment, we elected to keep the original Ala2 in our simulations.
RESULTS
Due to the unstructured nature of the terminal regions (residues 1–9 and 57–60), a truncated BdpA (residues 10–56) was used in most of the previously reported simulations. In this study, we chose to conduct simulations on both the truncated and the full-length versions in order to examine the effect of the unstructured region on the folding. To examine the effect of the generalized-Born models and temperature control schemes, we performed four sets of simulations with conventional molecular dynamics (CMD) and two sets of simulations with replica exchange molecular dynamics (REMD). Among the four sets of CMD simulations, two were conducted on the full-length BdpA with two different generalized-Born models, and the other two sets of simulations were conducted on the truncated BdpA with Berendsen et al.33 and Andersen34 thermostats, respectively. Each set of the CMD simulations comprises ten simulations of 1.0 μs per trajectory, for an aggregated total of 40.0 μs. We observed a very similar behavior in the two sets of simulations on the truncated BdpA with two different thermostats (see supplementary material). Therefore these two sets of simulations were combined in the analyses for improved statistics. Two sets of REMD simulations were performed on the full-length BdpA with two different generalized-Born models and each set comprised 20 replicas and 200.0 ns for each replica. We will first describe the kinetic folding events observed in the CMD simulations, followed by the temperature dependent thermodynamics from the REMD simulations, and finish with structure prediction by physical and statistical potentials. We will focus on the results of simulations of one of the generalized-Born models because they provide more reliable information on the process of reaching the native state. The results on the other generalized-Born model simulations will be discussed later.
Folding pathway of the truncated BdpA
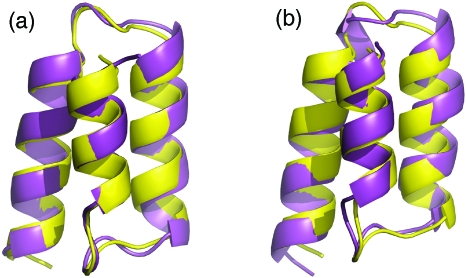
Among the 20 simulations on the truncated BdpA, the Cα RMSD of the best folded structure was 0.8 Å, which is notably better than the best structures in previous ab initio simulations (2.8 Å). Clearly, the simulations have successfully reached the native state. The best folded structure is shown in Fig. 2a overlaid with the NMR structure. To the best of our knowledge, this is the first time that ab initio folding simulations reached the native state of BdpA within the experimental uncertainty. Furthermore, it reached 2.0 Å RMSD in 5 trajectories and 3.0 Å in 14 trajectories within the 1.0 μs simulation time.
Figure 2.
Comparison of the simulated structures (magenta) and the NMR structure of BdpA (yellow, PDB code 1Q2N, first model). (a) The best folded structure with 0.8 Å Cα RMSD from the CMD of the truncated BdpA. (b) The best folded structure with 1.3 Å Cα RMSD from the REMD of the full-length BdpA.
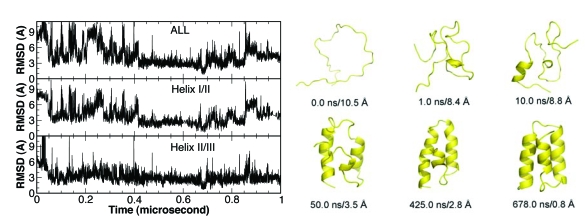
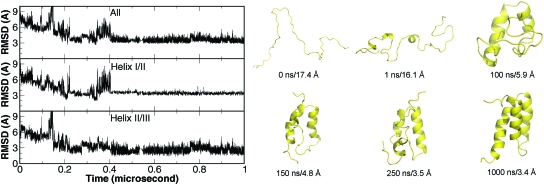
A representative folding trajectory is shown in Fig. 3. In this trajectory, BdpA reached the stable folded state between 400 and 700 ns. To further dissect the folding∕unfolding process, we monitored the folding of helices I∕II (residues 11–38) and helices II∕III (residues 24–55). It is evident from Fig. 3 that helices II∕III folded closer to the native structure than helices I∕II during the entire process. This is consistent in most of the folded trajectories. In this trajectory, helices II∕III folded to the native structure at near 50 ns and stayed mostly folded afterwards. Helices I∕II, on the other hand, underwent significant fluctuations, which caused the local unfolding after 700 ns.
Figure 3.
A representative folding trajectory from CMD of the truncated BdpA. Selected representative snapshots are also presented to visualize the folding process.
For better illustration of the folding process, selected snapshots from this trajectory are shown in Fig. 3. After minimization and initial equilibration, the protein remained rather extended. Within 1.0 ns, the protein quickly collapsed with almost no secondary structure formation. At 10 ns, partial formation of helix III was observed. At 50 ns, the helices II∕III segment was almost folded but helices I∕II segment was not. At 425 ns, the folding of helix II∕III segment further improved and helix I∕II segment started to fold. At 678 ns, helix I was complete and the entire protein reached the native state. The subsequent local unfolding and refolding was primarily due to the movement of helix I. Since the structure of the truncated BdpA has never been determined experimentally, we are uncertain whether this was caused by the truncation of the N-terminal segment (residues 1–9).
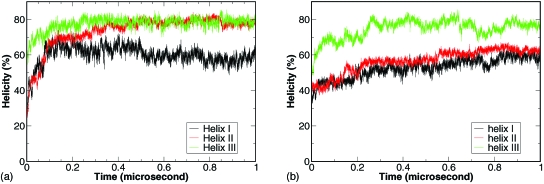
To investigate the contribution of the individual helices to the folding process, we calculated the development of the average helicity of the individual helices among the 20 trajectories. As shown in Fig. 4a, the development of helix III was the fastest and helix I was the slowest. Helix III reached 80% helicity near 50 ns. Helix II reached 65% near 100 ns and continued to develop to 80% near 450 ns. Helix I reached 60% near 100 ns and fluctuated around for the rest of the simulation. The difference in the development of individual helices suggest that the formation of helix III is the initiation step and the formation of helix I is the last step. It also suggests that helix III may have residual helical structures in the denatured state ensemble. The observation was in close agreement with the experimental results of helical structures of isolated helix III.7
Figure 4.
Development of average helicity of the individual helices from CMD of the truncated (a) and full-length (b) BdpA.
We also monitored the development of the two segments, namely, helices I∕II and helices II∕III, among the 20 trajectories (data not shown). On average, approximately 30% of the helices II∕III reached the folded state near 350 ns and fluctuated around 30%–40%. In contrast, folding of helices I∕II rarely went up above 10%, consistent with the analyses on the individual helices. This suggests that the helices II∕III segment may serve as a folding intermediate.
Folding pathway for the full-length BdpA
Among the ten simulations of the full-length BdpA, due to the larger system size, we observed only two folding processes out of the ten trajectories and one of them is shown in Fig. 5 that reached the nativelike states. In this trajectory, BdpA initially folded near 200 ns and eventually settled at a folded state after 400 ns. The helices II∕III segment folded near 150 ns and the helices I∕II segment folded near 200 ns. The fluctuation of the overall RMSD between 200 and 400 ns was mostly due to the instability of the helices I∕II segment. For better visualization of the folding process, selected snapshots from this trajectory are shown in Fig. 5.
Figure 5.
A representative folding trajectory from CMD of the full-length BdpA. Selected representative snapshots are also presented.
After minimization and initial equilibration, the protein remained rather extended with two sharp turns and collapsed into a coiled structure within 1 ns. At 100 ns, secondary structure was developed in helix III and C-terminal part of helix II, while helix I remained coiled. At 150 ns, helices II∕III reached the folded state and the overall topology of the protein resembled that of the native structure. At 250 ns, helix I remained largely unstructured. All three helices were formed in the final structure of the trajectory. Both the faster folding of helices II∕III segment and the reduced stability of helices I∕II segment were consistent with the truncated BdpA. In addition, we observed notably higher RMSD of the folded helices I∕II segment in the full-length BdpA, likely due to the interference of the 9 N-terminal residues which were absent in the truncated BdpA.
For further comparison with the truncated BdpA, we calculated the average helicity of the three helices [Fig. 4b]. Consistent features were observed between the full-length and truncated BdpA. As shown in Fig. 4b, the helicity of helix III reached 70% near 50 ns and 80% near 250 ns, while the helicity of helices I and II gradually increase from 40% to 60% level and helix I displayed slightly lower helicity than helix II. This once again demonstrated the faster formation of helix III compared to the other two helices. On the average, folding of helices II∕III segment was close to 20% towards the end of the simulation while the folding of helices I∕II segment was only sparsely observed (data not shown). Although the population of both folded segments were lower in the full-length BdpA in comparison to the truncated version, the faster folding of the helices II∕III segment was still very clear.
Folding thermodynamics from REMD
Due to the enhanced sampling, the folding of the full-length BdpA was better achieved in the REMD simulation. The best folded structure is shown in Fig. 2b with 1.3 Å Cα RMSD (for residues 10–56 since residues 1–9 and 57–60 are disordered in the NMR structures). For a better understanding of the conformational sampling, we performed clustering analysis and the five highest populated conformations at 295 K are shown in Fig. 6. The most populated conformation (64.1%) was a well-folded three helix bundle with a Cα RMSD around 3.1 Å from the NMR structure. The second most populated conformation (8.1%) had wider separation between helices II and III, therefore led to higher Cα RMSD (around 3.9 Å). The fourth most populated conformation (5.7%) was the best folded conformation with Cα RMSD around 2.6 Å. Among the five most populated clusters, three clusters that closely resemble the native structure have a combined population of 77.9%. The other two conformations were misfolded with significant native helices and folded helices II∕III segment. Overall, the high population of the native and near native conformations is encouraging.
Figure 6.
The representative structures of the five most populated clusters at 295 K from the REMD of the full-length BdpA. Note: These are the representative structures closest to the centers of the respective clusters and not the best folded structures among the clusters.
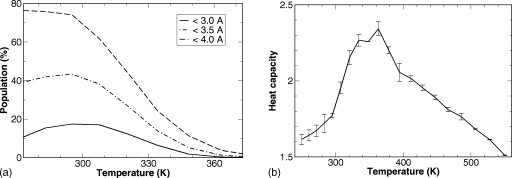
In addition to the better conformational sampling, temperature-dependent properties have been obtained from REMD simulation. The populations of the native and the near native conformations at different temperatures are shown in Fig. 7a. The population profile with Cα RMSD<4.0 Å, with a melting temperature Tm=325 K, resembles the melting curve observed in the experiments. Alternatively, a melting temperature Tm=362 K can be obtained from the heat capacity profile shown in Fig. 7b. The experimentally derived Tm=346 K is about half way between these two estimates.
Figure 7.
Temperature-dependent folding properties from the REMD of the full-length BdpA. (a) The population of native and near native conformations. (b) The heat capacity profile.
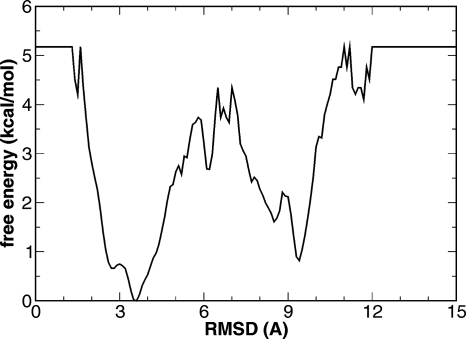
The free energy profile of BdpA at 295 K, calculated from the REMD simulations as the potential of mean force, is shown in Fig. 8. According to this profile, there is a broad native basin around 2.5–4.0 Å. The native state was favored by ∼0.8 kcal∕mol compared to the denatured state. A free energy barrier of ∼3.7 kcal∕mol separates the denatured state from the native state. These free energies were in qualitative agreement with those from experiments.
Figure 8.
Free energy profile of BdpA at 295 K from REMD of the full-length BdpA.
Structure prediction by physical and statistical potentials
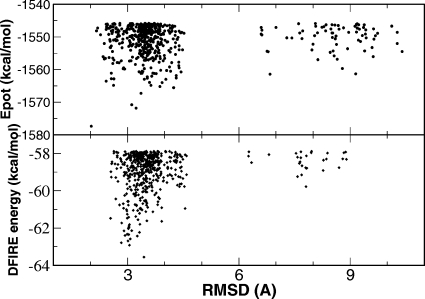
Besides revealing the kinetic and thermodynamic aspects of the folding mechanism, one of the ultimate goals of protein folding simulation is to be able to identify the correct native and near native structures from all sampled conformations. We investigated the structure prediction power of both physical energy (potential energy calculated by AMBER) and statistical potential [distance-scaled, finite ideal-gas reference (DFIRE) energy35]. All the snapshots from REMD simulation at 295 K were ranked by either physical energy or statistical potential. The RMSD distributions of the top ranked 500 structures are shown in Fig. 9. The overall distributions are similar and most of the top 500 structures are within the broad native basin (Cα RMSD<4.0 Å). More specifically, the lowest energy structure identified by the physical energy had a Cα RMSD of 2.02 Å, and the RMSDs of the next top four structures were 3.23, 3.11, 3.36, and 4.24 Å, respectively. The lowest energy structure identified by the statistical potential had a Cα RMSD of 3.44 Å, and the RMSDs of the next top four structures were 3.05, 2.83, 3.01, and 3.07 Å, respectively. Therefore physical energy had a slight edge as far as the No. 1 prediction is concerned. When the top 500 structures from these two energy rankings were compared, only ten structures were commonly recognized by both the physical energy and the statistical potential. For seven of these ten structures, the RMSD fell within the 3.08–3.52 Å range. The other three structures had RMSDs of 3.64, 3.83, and 4.43 Å, respectively. In summary, the physical energy and the statistical (DFIRE) potential demonstrated similar ability to identify the native and near native structures.
Figure 9.
RMSD and energy distribution of top ranked structures at 295 K from REMD of the full-length BdpA. Upper panel: Top 500 structures ranked by AMBER∕GB potential energy. Lower panel: Top 500 structures ranked by DFIRE statistical potential.
DISCUSSION
The folding process observed in our simulations is consistent with the observations from experiments. The early formation of helix III agrees with the experimental observations of higher stability of isolated helix III (Ref. 7) in comparison to the other two helices. We also observed consistently better formation of the helices II∕III intermediate which is in agreement with the experimental observation of initiation of unfolding at helix I and the low stability of the helices I∕II fragment.6 The more direct evidence of the existence of the helices II∕III intermediate was from the kinetic fluorescence study from which the same intermediate was proposed.9 A similar folding mechanism was proposed in a Φ analysis experiment with unstructured helices I and structured helices II∕III in the transition state.12 On another note, although the folding pathway has clearly been observed from our CMD simulations, the actual timescale for folding cannot be accurately represented due to the lack of consideration of solvent viscosity in our simulations. The folding time in our simulations was on the timescale of hundreds of nanoseconds which is approximately one order of magnitude faster than the experimentally determined folding time (∼4 μs).
Compared to the previous reports on the ab initio folding of BdpA, the current work is a significant improvement. In fact, to the best of our knowledge, this is the first time that an ab initio protein folding simulation ever reached the native state of this protein. Thus, the simulations have provided more insight, particularly at the late stage of folding which was completely absent in other simulations because of their inability to reach the native state. As we briefly discussed earlier, in previous studies, the lowest Cα RMSD was greater or equal to 2.8 Å which was nativelike states. In other words, the native state has never been sampled in those simulations. In current work our, the native state was consistently sampled in both CMD and REMD simulations and the lowest RMSD of 0.8 Å was close to the experimental error of high resolution structure determination. Due to the limited sampling, previous works were limited to the earlier events but were unable to provide any information regarding the completion of the folding which is critically needed to understand the folding process. For example, our observation of early formation of helix III in current work is consistent with two of the previous reports. However, all previous works failed to identify the intermediate state with well folded helix II∕III segment which has been suggested in the experiments. Therefore, the folding processes observed in low quality folding simulations are often unreliable.
Solvation model contributes significantly to the quality of the model. Previously we applied AMBER FF03 (Ref. 30) and an earlier generalized-Born solvation model [Hawkins, Cramer, and Truhlar (HCT) model]36 to study the folding of BdpA (Ref. 28) (the truncated version). In that study, the overall folding occurred only transiently to 2.8 Å in one of the sixteen trajectories (400 ns each). We also performed another set of simulations with a more recent generalized-Born model32 and mixed results were obtained in which folding was not observed in a set of ten CMD simulations (each to 1.0 μs) but the native conformation with 1.1 Å Cα RMSD were sampled in a set of REMD simulations, albeit with very low population. Since we used the same force field30 (FF03) in all these simulations, the observed differences can be directly attributed to the differences among the generalized-Born models. Based on the parametrization of small molecules, the earlier GB model (HCT model36) uses the van der Waals surface as surface model and tends to overstabilize the native structure. The GB model used in this study [Onufriev, Bashford, and Case (OBC) model 2 (Ref. 31)] modified the calculation of Born radii and improved the accuracy in the solvent polarization for macromolecules. The most recent GB model32 added volume correction to reduce the artifact caused by internal cavity. It should be noted that all these GB models are Coulomb field based models. Continuous effort in improving the GB models especially non-Coulomb field based models has led to significantly better agreement with Poisson–Boltzman (PB) model.37, 38, 39, 40, 41 However, as pointed out by Zhu et al.,42 better agreement with PB model does not guarantee better performance on protein folding which is one of the most stringent tests. It should be noted that the PB model itself is under significant improvement with recent work on the PB radii and nonelectrostatic solvation treatment.43, 44 Encouragingly, the combination of FF03 (Ref. 30) with the GB model31 used in this work (OBC model 2) led to the successful folding of multiple small proteins, including villin headpiece subdomain,45, 46 albumin binding domain,47 and protein A.
Other than the pitfalls of the solvation models, artifacts may also exist in the force field. In this work, a high population of the folded conformation and very good consistency with the NMR structure in the simulated structures were observed. In addition, the melting curve obtained from our simulation resembled the experimentally derived melting curve, and the melting temperatures from the two sources were close to each other.10 However, the small population of the folded conformations with Cα RMSD<3.0 Å compared to that of the conformations with 3.0 Å<Cα RMSD<4.0 Å may be an indication of the inaccuracy in the force field. We further conducted a number of 50 ns simulations that started from the NMR structure in which the RMSD fluctuated mostly within the range of 0.7–2.0 Å, suggesting that the native basin should be restricted to Cα RMSD<2.0 Å.
The broad native basin was partly caused by the non-native packing of the three helices, as indicated by the low occupancy of the native tertiary contacts in the simulation (data not shown). Although the individual helices were well formed in the simulations, their sidechain packing and the interactions between the helices require the precise native packing pattern. It should be noted that side chain packing is very sensitive to the overall structure and slight fluctuations in the main chain torsion angles may propagate and lead to poor side chain packing. Thus, to reach the native structure with native packing, the protein needs to have correct packing of interior side chains as well as the formation of secondary structure elements with correct boundaries. In many cases, repacking requires partial unfolding of the structures, including transient disruption of the tertiary contacts. This was consistently observed in the simulations in which improvements in the structures (toward smaller Cα RMSD) were often preceded by transient unfolding and increases in Cα RMSD.
Examination of the simulation trajectories further revealed that Phe31 may play a critical role in the folding. In the NMR structure, Phe31 is sandwiched between helices II and III and is partially responsible for holding the helix hairpin (helices II and III). In our simulation, most of the low quality folding (Cα RMSD>2.5 Å) and misfolding were caused by the mispacking of Phe31 with a flipped χ1 torsion angle. The misplacement of Phe31 side chain prevented helix I from docking to the helix II∕III. It also prevented both the formation and the stabilization of helix II∕III segment itself. In most of the folding trajectories, packing of Phe31 to the correct conformation immediately led to the completion of folding to the native state with Cα RMSD smaller than 2.0 Å. This observation is quite consistent with the experimental results of Sato et al.12 who systematically measured the Φ-values through measurement of folding and unfolding rates. In their measurement,48 they found that F31G mutation was the most disruptive mutation, reducing the folding rate by more than 60 times, notably more than any other Gly mutations. The second highest was R28G mutation (15 times). Clearly, part of this was due to the lower helical tendency of Gly. Yet, the fact that the F31G has the largest effect among all Gly mutations is directly attributable to the crucial roles of Phe31 in the folding process. Our simulation suggests that one of the crucial roles that Phe31 may play is to stabilize the helix hairpin.
Clearly, there is also room for improvement in structure prediction. We obtained 1.3 Å Cα RMSD structure from the REMD simulation of the full-length protein. However, the best prediction by either physical or statistical potential was only 2.0 Å Cα RMSD and most of the predicted structures fell between 3.0 and 3.5 Å Cα RMSD. Part of the problem was likely due to the lack of consideration of protein internal entropy in the scoring function (either the physical or statistical potential). As a participating group in the critical assessment of techniques for protein structure prediction (CASP) structure refinement experiment,49 we are currently working on the recognition of the well-folded and refinement of the less well-folded structures. We also note that because the entropy contribution is considered in the MD simulations through the dynamics, the internal entropic term of the protein is not (and should not be) directly modeled in the molecular mechanics force fields (other than the solvation part which is represented in the generalized-Born model). Thus, the combination of the force field and the solvent model is not a complete description of the free energy. Nevertheless, we are very encouraged that the structures with the lowest physical energy had only 2.0 Å Cα RMSD. Further improvements are anticipated when the entropic terms are considered properly.
CONCLUSIONS
In this work, we investigated the folding mechanism of the B domain of protein A by all-atom molecular dynamics simulation starting from a fully extended conformation. For the first time in the ab initio folding of BdpA, the protein reached the native state within the experimental error as close as 0.8 Å Cα RMSD. High population of the folded conformation was observed in the REMD simulation. Consistent with the experiments, the CMD simulations revealed the critical roles of Phe31. The folding of BdpA started with the formation of helix III, followed by the folding of the helices II∕III segment, and completed with the docking of helix I to this segment. The experimentally measured Tm(346 K) fell between the two estimations from our simulation: 325 K from the melting curve and 362 K from the heat capacity profile. Furthermore, most of the structure predictions by physical or statistical potentials were within 3.0–3.5 Å and the structure with the lowest physical energy had only 2.0 Å Cα RMSD.
METHODS
The simulations were conducted with the AMBER simulation package.50, 51 The all-atom point-charge force field FF03 (Ref. 30) was chosen to represent the protein. The combined GB (Refs. 31, 32) and surface area model was chosen to mimic solvation effect (surface tension of 0.005 kcal∕mol∕Å2). Two GB models, one by Onufriev et al. developed in 2004 (Ref. 31) (OBC model) and the other by Mongan et al.32 released in 2007, have been tested in the simulations. Starting from the extended polypeptide chain of the B domain of protein A (either the truncated or full-length version), short minimization (1000 steps) and equilibration (20 ps with random seed at 300 K) were applied to the system. These randomly collapsed structures after the equilibration step served as the starting point for the simulation trajectories. There were 20 replicas in the REMD (Ref. 52) simulations and the targeting temperatures were 250.0, 260.6, 271.6, 283.1, 295.1, 307.6, 320.7, 334.3, 348.4, 363.2, 378.6, 394.6, 411.3, 428.8, 446.9, 465.9, 485.6, 506.2, 527.6, and 550.0 K. Temperature exchanges were attempted every 2000 steps. The temperature was set to 300 K in CMD simulations. In most simulations, temperature was controlled by applying the thermostat of Berendsen et al.33 with a coupling time constant of 2.0 ps. In an additional set of ten CMD simulations of the truncated BdpA, Andersen’s thermostat34 was applied with a coupling time constant of 10.0 ps. Ionic strength was set to 0.2M. The cutoff for both general nonbonded interaction and GB pairwise summation were set to 12 Å. The time step was 2 fs in CMD and 1 fs in REMD. SHAKE was applied for hydrogen-connected bond constraint.53 Slow-varying terms were evaluated every four steps. The coordinates were saved every 10 ps in CMD and 2 ps in REMD. The simulations were run on a AMD dual core Opteron cluster (four CPUs on each node) and it took ∼70 days to complete each 1.0 μs CMD simulation of the truncated BdpA and ∼50 days to complete the 200 ns REMD simulation of the full length BdpA.
Due to the lower resolution, the earlier NMR structure of the B domain of protein A (PDB code 1BDC) was not used as the reference. In stead, the NMR structure of the more recent Z domain of protein A (PDB code 1Q2N) was used as the reference structure to monitor the folding process. Clustering was conducted on the REMD trajectories at each temperature. The snapshots were clustered using a hierarchical clustering method. Two snapshots are considered as neighbors when their pairwise Cα RMSD is below 2.5 Å. The N-terminal nine residues and C-terminal four residues of the full length BdpA were excluded in the clustering and other RMSD calculations due to high flexibility. Within each cluster, the snapshot with the most neighbors was identified as the center of the cluster. The process was iterated to identify other clusters from the remaining snapshots. Heat capacity was calculated using C=(⟨E2⟩−⟨E⟩2)∕RT2, where E is the potential energy, R is the gas constant, and T is the temperature. Helicity was evaluated using a simple main chain dihedral cutoff: Φ=−57°±40° and Ψ=−47°±40°.
ACKNOWLEDGMENTS
We are grateful to the AMBER development community led by Dr. Case whose effort has made this work possible. We thank Professor Fersht and Dr. Sato for sharing their extensive and detailed kinetic data. This work was supported by research grants from NIH [Grant Nos. GM64458 and GM67168 to one of the authors and (Y.D.) R01 GM066049 and R01 GM068530 to another author (Y.Z.)]. Usage of Pymol, GRACE, VMD, and Rasmol graphics packages are gratefully acknowledged.
References
- Stefani M., Biochim. Biophys. Acta 1739, 5 (2004). [DOI] [PubMed] [Google Scholar]
- Deisenhofer J., Biochemistry 10.1021/bi00512a001 20, 2361 (1981). [DOI] [PubMed] [Google Scholar]
- Gouda H., Torigoe H., Saito A., Sato M., Arata Y., and Shimada I., Biochemistry 10.1021/bi00155a020 31, 9665 (1992). [DOI] [PubMed] [Google Scholar]
- Tashiro M., Tejero R., Zimmerman D. E., Celda B., Nilsson B., and Montelione G. T., J. Mol. Biol. 10.1006/jmbi.1997.1265 272, 573 (1997). [DOI] [PubMed] [Google Scholar]
- Zheng D. Y., Aramini J. M., and Montelione G. T., Protein Sci. 10.1110/ps.03351704 13, 549 (2004). [DOI] [PMC free article] [PubMed] [Google Scholar]
- Bottomley S. P., Popplewell A. G., Scawen M., Wan T., Sutton B. J., and Gore M. G., Protein Eng. 10.1093/protein/7.12.1463 7, 1463 (1994). [DOI] [PubMed] [Google Scholar]
- Bai Y. W., Karimi A., Dyson H. J., and Wright P. E., Protein Sci. 6, 1449 (1997). [DOI] [PMC free article] [PubMed] [Google Scholar]
- Myers J. K. and Oas T. G., Nat. Struct. Biol. 10.1038/88626 8, 552 (2001). [DOI] [PubMed] [Google Scholar]
- Vu D. M., Myers J. K., Oas T. G., and Dyer R. B., Biochemistry 10.1021/bi036203s 43, 3582 (2004). [DOI] [PubMed] [Google Scholar]
- Dimitriadis G., Drysdale A., Myers J. K., Arora P., Radford S. E., Oas T. G., and Smith D. A., Proc. Natl. Acad. Sci. U.S.A. 10.1073/pnas.0306433101 101, 3809 (2004). [DOI] [PMC free article] [PubMed] [Google Scholar]
- Vu D. M., Peterson E. S., and Dyer R. B., J. Am. Chem. Soc. 10.1021/ja048416q 126, 6546 (2004). [DOI] [PubMed] [Google Scholar]
- Sato S., Religa T. L., Daggett V., and Fersht A. R., Proc. Natl. Acad. Sci. U.S.A. 10.1073/pnas.0401396101 101, 6952 (2004). [DOI] [PMC free article] [PubMed] [Google Scholar]
- Kolinski A. and Skolnick J., Proteins: Struct., Funct., Genet. 10.1002/prot.340180406 18, 353 (1994). [DOI] [PubMed] [Google Scholar]
- Islam S. A., Karplus M., and Weaver D. L., J. Mol. Biol. 10.1016/S0022-2836(02)00029-3 318, 199 (2002). [DOI] [PubMed] [Google Scholar]
- Lucas A., Huang L., Joshi A., and Dill K. A., J. Am. Chem. Soc. 10.1021/ja067153s 129, 4272 (2007). [DOI] [PubMed] [Google Scholar]
- Zhou Y. Q. and Karplus M., J. Mol. Biol. 10.1006/jmbi.1999.2936 293, 917 (1999). [DOI] [PubMed] [Google Scholar]
- Zhou Y. Q. and Karplus M., Nature (London) 10.1038/43937 401, 400 (1999). [DOI] [PubMed] [Google Scholar]
- Linhananta A., Zhou H. Y., and Zhou Y. Q., Protein Sci. 10.1110/ps.0205002 11, 1695 (2002). [DOI] [PMC free article] [PubMed] [Google Scholar]
- Zhou Y. Q. and Linhananta A., J. Phys. Chem. B 10.1021/jp013824r 106, 1481 (2002). [DOI] [Google Scholar]
- Linhananta A. and Zhou Y. Q., J. Chem. Phys. 10.1063/1.1514574 117, 8983 (2002). [DOI] [Google Scholar]
- Berriz G. F. and Shakhnovich E. I., J. Mol. Biol. 10.1006/jmbi.2001.4792 310, 673 (2001). [DOI] [PubMed] [Google Scholar]
- Alonso D. O. V. and Daggett V., Proc. Natl. Acad. Sci. U.S.A. 10.1073/pnas.97.1.133 97, 133 (2000). [DOI] [PMC free article] [PubMed] [Google Scholar]
- Boczko E. M. and Brooks C. L., Science 10.1126/science.7618103 269, 393 (1995). [DOI] [PubMed] [Google Scholar]
- Guo Z. Y., Brooks C. L., and Boczko E. M., Proc. Natl. Acad. Sci. U.S.A. 10.1073/pnas.94.19.10161 94, 10161 (1997). [DOI] [PMC free article] [PubMed] [Google Scholar]
- Garcia A. E. and Onuchic J. N., Proc. Natl. Acad. Sci. U.S.A. 10.1073/pnas.2335541100 100, 13898 (2003). [DOI] [PMC free article] [PubMed] [Google Scholar]
- Vila J. A., Ripoll D. R., and Scheraga H. A., Proc. Natl. Acad. Sci. U.S.A. 10.1073/pnas.2436463100 100, 14812 (2003). [DOI] [PMC free article] [PubMed] [Google Scholar]
- Jang S. M., Kim E., Shin S., and Pak Y., J. Am. Chem. Soc. 10.1021/ja034701i 125, 14841 (2003). [DOI] [PubMed] [Google Scholar]
- Chowdhury S., Lei H. X., and Duan Y., J. Phys. Chem. B 10.1021/jp0449814 109, 9073 (2005). [DOI] [PubMed] [Google Scholar]
- Jagielska A. and Scheraga H. A., J. Comput. Chem. 10.1002/jcc.20631 28, 1068 (2007). [DOI] [PubMed] [Google Scholar]
- Duan Y., Wu C., Chowdhury S., Lee M. C., Xiong G., Zhang W., Yang R., Cieplak P., Luo R., Lee T., Caldwell J., Wang J., and Kollman P., J. Comput. Chem. 10.1002/jcc.10349 24, 1999 (2003). [DOI] [PubMed] [Google Scholar]
- Onufriev A., Bashford D., and Case D. A., Proteins: Struct., Funct., Bioinf. 55, 383 (2004). [DOI] [PubMed] [Google Scholar]
- Mongan J., Simmerling C., McCammon J. A., Case D. A., and Onufriev A., J. Chem. Theory Comput. 10.1021/ct600085e 3, 156 (2007). [DOI] [PMC free article] [PubMed] [Google Scholar]
- Berendsen H. J. C., Postma J. P. M., Vangunsteren W. F., Dinola A., and Haak J. R., J. Chem. Phys. 10.1063/1.448118 81, 3684 (1984). [DOI] [Google Scholar]
- Andersen H. C., J. Chem. Phys. 10.1063/1.439486 72, 2384 (1980). [DOI] [Google Scholar]
- Zhang C., Liu S., Zhou H. Y., and Zhou Y. Q., Protein Sci. 10.1110/ps.03348304 13, 400 (2004). [DOI] [PMC free article] [PubMed] [Google Scholar]
- Onufriev A., Bashford D., and Case D. A., J. Phys. Chem. B 10.1021/jp994072s 104, 3712 (2000). [DOI] [Google Scholar]
- Tjong H. and Zhou H. X., J. Phys. Chem. B 10.1021/jp066284c 111, 3055 (2007). [DOI] [PubMed] [Google Scholar]
- Wojciechowski M. and Lesyng B., J. Phys. Chem. B 10.1021/jp046748b 108, 18368 (2004). [DOI] [Google Scholar]
- Feig M. and Brooks C. L., Curr. Opin. Struct. Biol. 10.1016/j.sbi.2004.03.009 14, 217 (2004). [DOI] [PubMed] [Google Scholar]
- Bashford D. and Case D. A., Annu. Rev. Phys. Chem. 10.1146/annurev.physchem.51.1.129 51, 129 (2000). [DOI] [PubMed] [Google Scholar]
- Cramer C. J. and Truhlar D. G., Chem. Rev. (Washington, D.C.) 10.1021/cr960149m 99, 2161 (1999). [DOI] [PubMed] [Google Scholar]
- Zhu J., Alexov E., and Honig B., J. Phys. Chem. B 10.1021/jp046307s 109, 3008 (2005). [DOI] [PubMed] [Google Scholar]
- Tan C., Tan Y. H., and Luo R., J. Phys. Chem. B 10.1021/jp073399n 111, 12263 (2007). [DOI] [PubMed] [Google Scholar]
- Tan C. H., Yang L. J., and Luo R., J. Phys. Chem. B 10.1021/jp063479b 110, 18680 (2006). [DOI] [PubMed] [Google Scholar]
- Lei H., Wu C., Liu H., and Duan Y., Proc. Natl. Acad. Sci. U.S.A. 10.1073/pnas.0608432104 104, 4925 (2007). [DOI] [PMC free article] [PubMed] [Google Scholar]
- Lei H. and Duan Y., J. Mol. Biol. 370, 196 (2007). [DOI] [PMC free article] [PubMed] [Google Scholar]
- Lei H. and Duan Y., J. Phys. Chem. B 10.1021/jp0704867 111, 5458 (2007). [DOI] [PubMed] [Google Scholar]
- Sato M. and Fersht A. R., J. Mol. Biol. 10.1016/j.jmb.2007.06.043 372, 254 (2007). [DOI] [PubMed] [Google Scholar]
- Valencia A., Bioinformatics 10.1093/bioinformatics/bti249 21, 277 (2005). [DOI] [PubMed] [Google Scholar]
- Case D. A., Cheatham T. E., Darden T., Gohlke H., Luo R., Merz K. M., Onufriev A., Simmerling C., Wang B., and Woods R. J., J. Comput. Chem. 10.1002/jcc.20290 26, 1668 (2005). [DOI] [PMC free article] [PubMed] [Google Scholar]
- Case D. A., Darden T. A., Cheatham T. E. I.et al. , AMBER 8 (University of California, San Francisco, 2004).
- Hansmann U. H. E. and Okamoto Y., Phys. Rev. E 10.1103/PhysRevE.56.2228 56, 2228 (1997). [DOI] [Google Scholar]
- Ryckaert J. P., Ciccotti G., and Berendsen H. J. C., J. Comput. Phys. 10.1016/0021-9991(77)90098-5 23, 327 (1977). [DOI] [Google Scholar]


