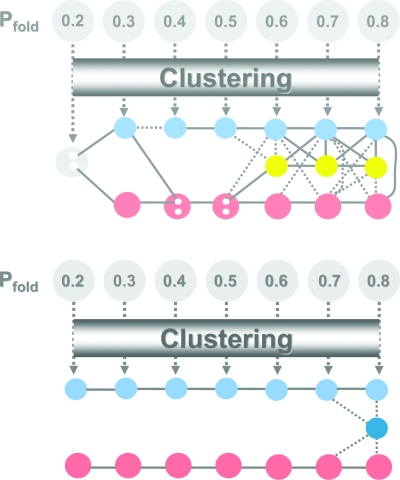
Figure 4.
Structural classes found along the reaction coordinate Pfold for geometry 1 (top) and geometry 2 (bottom). In both graphs the dominant cluster (i.e., the giant component) is shown on the bottom row, while the subdominant cluster is represented on the top row. For geometry 2, a trapped state appears at Pfold=0.8, while for geometry 1 a third cluster, of size similar to that of the subdominant cluster, develops from Pfold=0.6 onward. Two clusters are connected through a dotted line if (on average) their conformations share between 0.45 and 0.55 native bonds. A full line is drawn between clusters if their average similarity parameter is larger than 0.55. Alternatively, no line is drawn between clusters if .

