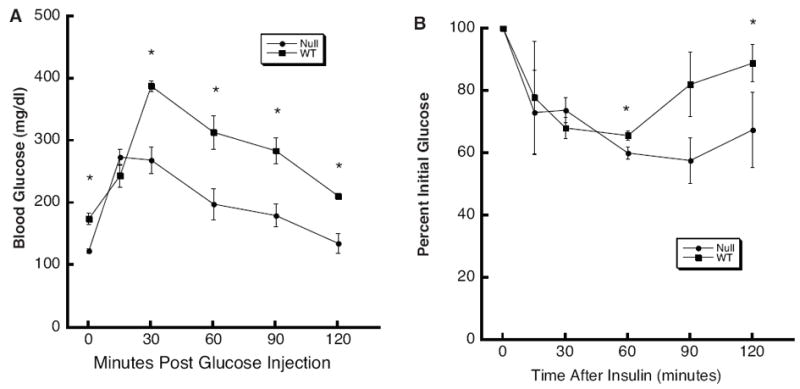
Figure 6.

The Thrsp null mouse exhibits improved glucose and insulin tolerance. A. Glucose tolerance test. Seven month old male N11 mice maintained on a 4% fat diet were injected with 20% glucose i.p.. Blood glucose levels were measured at the indicated times post-injection. All data represent the mean ± SEM (n = 6). The asterisk indicates a statistically significant difference in blood glucose levels as determined by ANOVA (p<0.01). B. Insulin tolerance test. In a separate set of N11 mice of the same age, blood glucose levels were measured at the indicated times post insulin injection. All data represent the mean ± SEM (n = 4). The asterisk indicates a statistically significant difference in blood glucose levels as determined by ANOVA.
