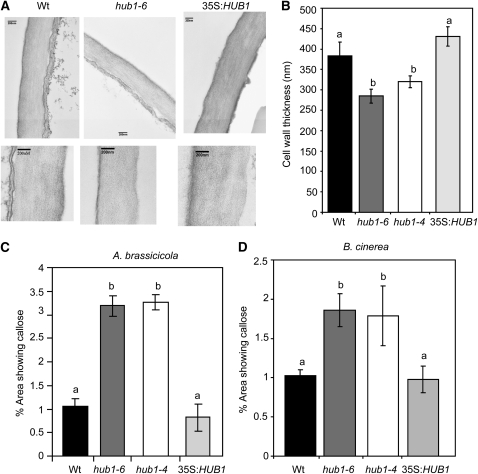
Figure 4.
hub1 Plants Show Reduced Cell Wall Thickness in Epidermal Tissues but Increased Callose Accumulation at the Site of Fungal Infections.
(A) Representative pictures showing the size of epidermal cell wall.
(B) Mean thickness of epidermal cell walls.
(C) and (D) hub1 plants show increased callose accumulation at the site of A. brassiciola (C) and B. cinerea (D) inoculation.
In (A), the bars = 200 nm. In (B), the data represent mean ± se from 20 samples. The experiment was repeated twice. The statistical significance of the differences in the mean thickness of the cell wall was analyzed as described in the legend for Figure 1. Means followed by different letters are significantly different from each other (P = 0.05). In (C) and (D), the callose staining assays were from plants 2 d after drop inoculation with 5 × 10⁵ A. brassicicola spores/mL (middle) or 5 × 10⁴ Botrytis spores/mL. The callose data shown in (C) and (D) were quantified using an image analysis program as described in Methods.

