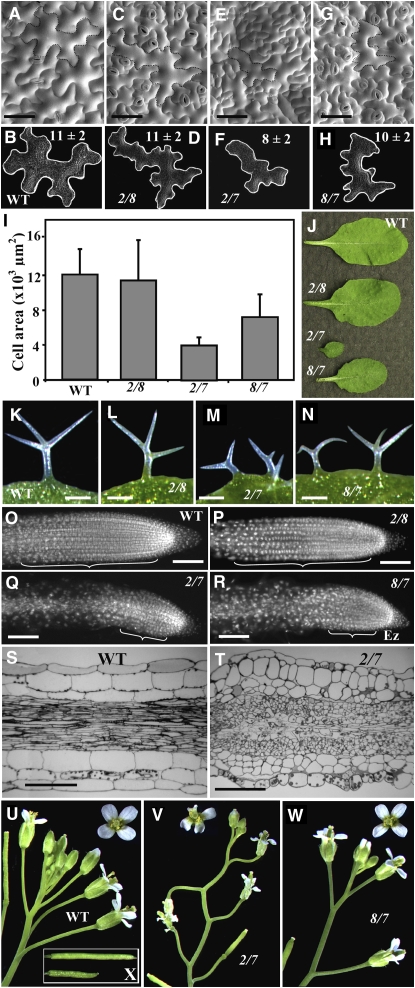
Figure 7.
Defects in Cell Division and Expansion in the Vegetative Actin Double Mutants.
(A) to (H) Scanning electron micrographs of leaf epidermis (adaxial) of the wild type ([A] and [B]) and act2-1 act8-2 ([C] and [D]), act2-1 act7-4 ([E] and [F]), and act8-2 act7-4 ([G] and [H]) double mutants. Pavement cells indicated with dotted lines in the top row ([A], [C], [E], and [G]) are marked along their edges and shown in the second row ([B], [D], [F], and [H]). The numbers on the top of images in the second row indicate the average number of lobes ± sd, calculated from 30 representative cells for each sample.
(I) Cell surface area. Vertical bars represent sd (n = 30).
(J) Rosette leaves.
(K) to (N) Leaf trichomes.
(O) to (R) Organization of cells in 4',6-diamidino-2-phenylindole–stained root apices of 10-d-old seedlings. The brackets indicate the zone of elongation.
(S) and (T) Light micrographs of longitudinal sections of wild-type (S) and act2-1 act7-4 double mutant (T) hypocotyls.
(U) to (W) Inflorescences. Single flower insets are shown at the top of each panel.
(X) Mature siliques of the wild type (top) and the act2-1 act7-4 double mutant (bottom).
Bars = 50 μm in (A), (C), (E), (G), and (O) to (R) and 100 μm in (K) to (N), (S), and (T).

