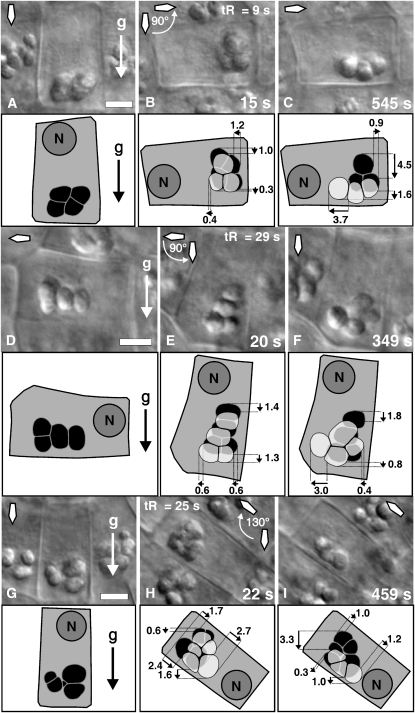
Figure 5.
Comparative Distances Covered by the Statoliths in the Central S2 Columella Cells from Arabidopsis within a Few Seconds (15 to 22 s) Relative to Longer (345 to 545 s) Time Intervals after Reorientation.
(A) Position of statoliths (black) immediately before reorientation.
(B) Displacement of the statoliths (transparent gray) 15 s after 90° root reorientation superimposed on the position of the amyloplasts before reorientation (black).
(C) Displacement of the statoliths 545 s after reorientation superimposed on the position of statoliths 15 s after reorientation; duration of reorientation tR = 9 s.
(D) Position of statoliths (black) in a horizontally oriented root immediately before reorientation.
(E) Position of statoliths (transparent gray) 20 s after 90° downward-directed reorientation superimposed on the position of the amyloplasts before reorientation (black).
(F) Displacement of the statoliths 349 s after reorientation superimposed on the position of statoliths 20 s after reorientation; duration of reorientation tR = 29 s.
(G) Position of statoliths (black) immediately before reorientation.
(H) Position of statoliths (transparent gray) 22 s after 130° reorientation superimposed on the position of statoliths before reorientation (black).
(I) Statolith displacement 459 s after reorientation superimposed on the position of statoliths 22 s after reorientation; duration of reorientation tR = 25 s.
DIC micrographs are shown above the corresponding models. Small black arrows indicate the direction of movement, and numbers display distances in microns. The gravity vector (g), the position of the cell nucleus (N), and the orientation of the root (diamond-shaped arrow) within the gravity field are as indicated. tR, duration of reorientation (s). Bars = 5 μm.

