
Fig. 4.
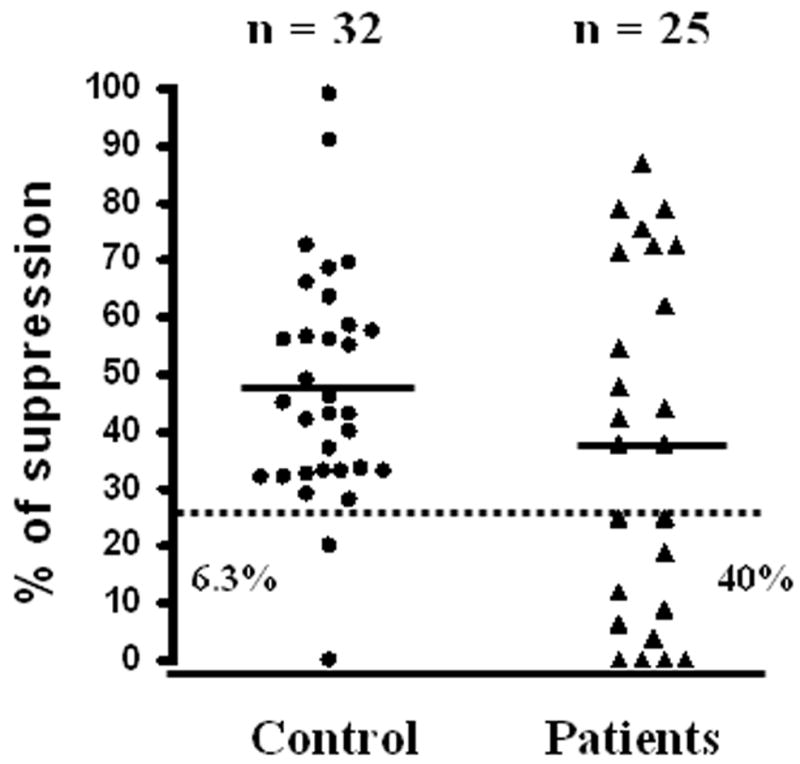
Suboptimal suppression in T1D subjects. The percentages of suppression of CD4+CD25−T cell proliferation by CD4+CD25+ Treg (Treg: Teff ratio: 1:1) are shown for normal controls (black circles) and T1D patients (black triangles). Horizontal solid lines represent means; dashed line represents the cutoff (25%) for high versus low suppression; n is the number of subjects in each group. The percentages of subjects below the cutoff are also shown for controls (6.3%) and T1D subjects (40%).