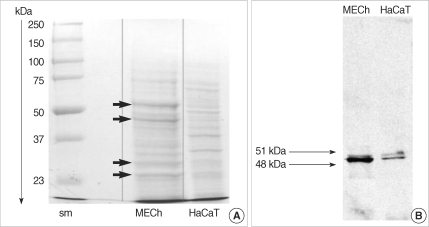
Fig. 5.
Comparative study on total protein profile (A) and cytokeratin profile (B) between primary middle ear cholesteatoma (MECh) keratinocytes and HaCaT cells. Middle ear cholesteatoma keratinocytes show different protein profile (arrows) in comparison with HaCaT cells. Blotting with anti-cytokeratin antibody shows the expression of cytokeratin 13 and 16 in both middle ear cholesteatoma keratinocytes and HaCaT cells.

