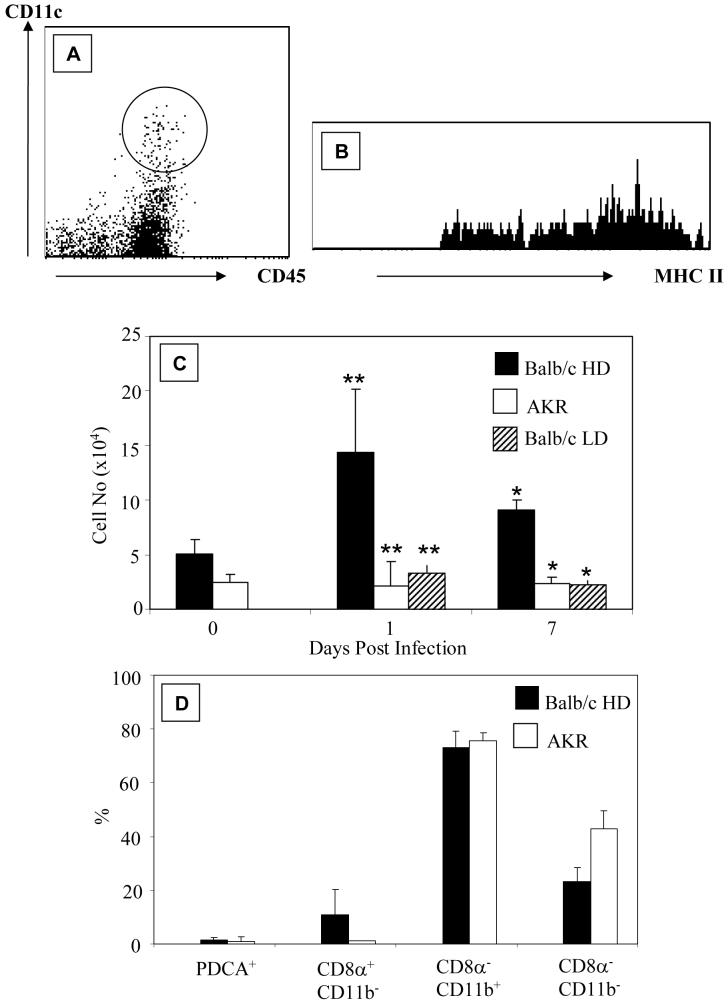
Figure 1. Rapid Recruitment of Colonic DCs in T. muris infected Resistant Mice.
Colonic lamina propria cells were identified by flow cytometry using CD45, CD11c and MHC II. Data shows representative profile of CD11c and CD45 expression (A). The region drawn around CD45+CD11c+ cells was used to determine MHCII expression (B). (C) shows the number of DCs in BALB/c and AKR mice pre (0) and post-infection with 150 (HD BALB/c; AKR) or 20 embryonated T.muris eggs (LD BALB/c). (D) shows the subtypes of colonic DCs in AKR and BALB/c mice. The data is from 4-9 experiments. *p<0.01, **p<0.001 comparing resistant versus susceptible mice at the same time point.

