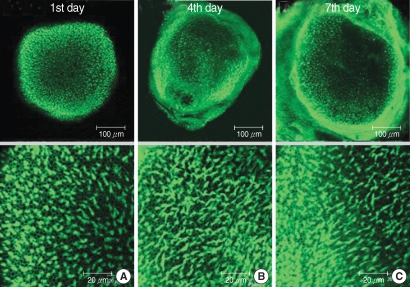
Fig. 1.
Photomicrographs showing utricular organotypic cultures labeled phalloidin-FITC in control group. Left column shows rat's utricle at the 1st day after utricle culture (A). Median (B) and right (C) column are the 4th and 7th days'utricle findings. The number of live hair cells were 292.8±21.8 (n=5), 292.0±10.1 (n=5), and 288.4±8.0 (n=5) in group C at the 1st, 4th, and 7th day after culture stated. Scale bar shown in each panels.

