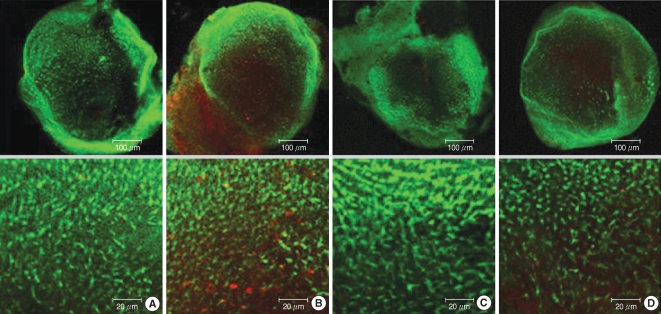
Fig. 9.
Photomicrographs showing red caspase-3 substrate activation in normal utricular culture (A column), utricular cultures treated with 1 mM gentamicin (B column), utricular cultures treated with 50 µM melatonin (C column), and utricular cutures treated with gentamicin 1 mM plus 50 µM melatonin (D column). Caspase-3 expression of utricle presented in following order of intensity, group G (B), group GM2 (D), group M (C), and group C (A). Scale bar shown in panels.

