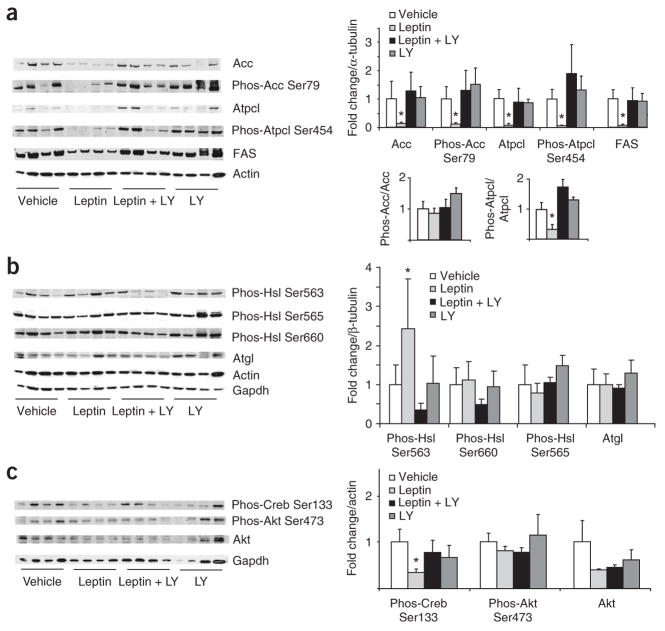
Figure 3.
PI3K signaling is required for the central effects of leptin on WAT metabolism. (a) Left, western blot analysis of WAT lysates from rats that received 4-h MBH infusions of either vehicle, leptin, leptin plus the PI3K inhibitor LY294002 (LY) or LY294002 alone. Right, quantification of the infrared scanned images normalized over α-tubulin and expressed as fold change compared to vehicle. Lower right, phospho-Acc is normalized to total Acc and phospho Atpcl is normalized to total Atpcl. (b) Left, western blot analyses of the indicated Hsl phosphorylations, Atgl and the two housekeeping genes actin and Gapdh. Right, the corresponding quantification of the western blot data normalized over alpha tubulin and expressed as fold change compared to vehicle. (c) Left, western blot analysis of Creb and Akt activation, as assessed by phosphospecific antibodies. Right, quantification of western blot analysis. *P < 0.05 versus MBH vehicle–treated group.

