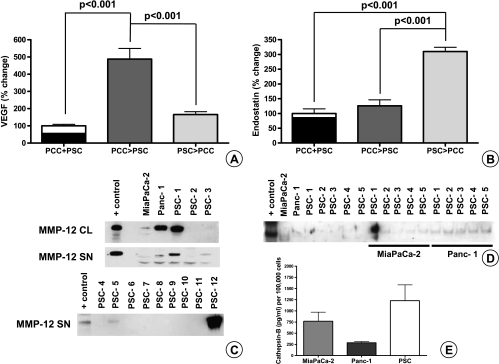
Figure 7.
Quantification of secreted VEGF and endostatin by ELISA after exchange of SNs between PSCs and PCCs and assessment of MMP-12 and cathepsin B production by PSCs and PCCs: PSC (200,000 cells per well) and PCC (400,000 cells per well) were cultured in serum-free medium. After 24 hours, the individual SNs were exchanged and kept on the reciprocal cells for another day. PCC > PSC denotes cancer cell SN added to PSC; PSC > PCC denotes PSC SN added to cancer cells. In the control wells, serum-free medium was used to incubate the cells for 24 hours. The amount of VEGF (A) and endostatin (B) secreted was quantified by ELISA. In the control columns (PCC + PSC), the VEGF and endostatin produced by PCCs in 24 hours (black column) are mathematically added to the amount produced by the PSCs (white column above the black). The experiments were repeated three times using different PSC clones. Immunoblot analysis was used to measure the MMP-12 in the CLs and in the SN of cells (C). Five nanograms of MMP-12 was loaded to the first column as positive control (AG902; Millipore). MMP-12 secreted by cocultured PCC and PSC is shown (D). Secreted cathepsin B was quantified by ELISA (E). Error bars, SEM.

