
Figure 12.
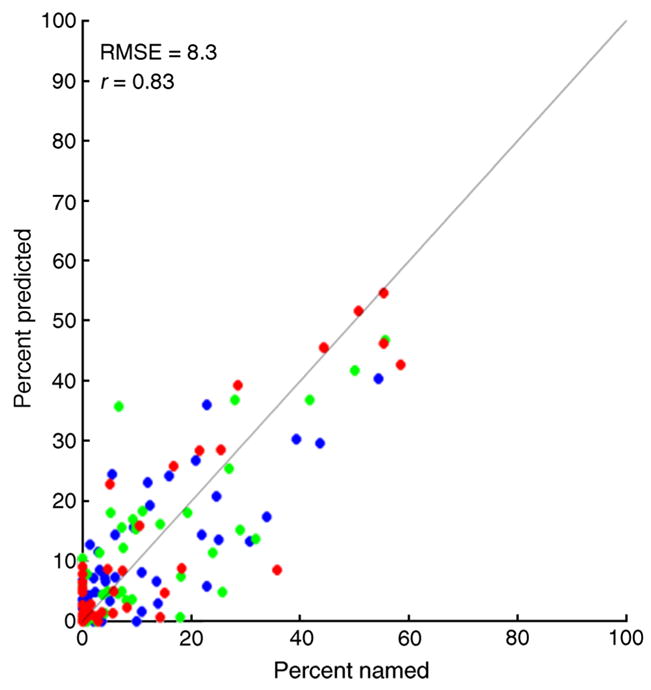
Summary of prediction of color names. Each plotted point shows predicted percent named against measured percent named. Data for all 5 observers and all color names (including white). Blue points: 500-nm spots; green points: 550-nm spots; red points; 600-nm spots.