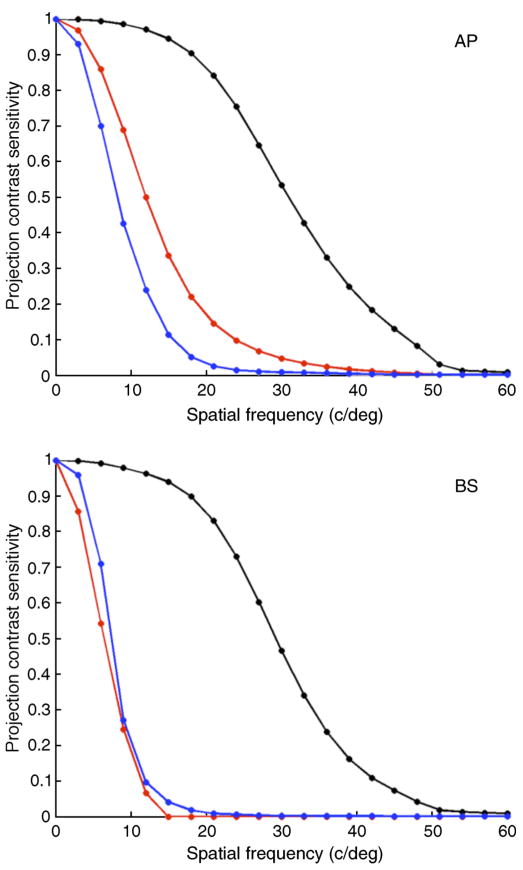
Figure 17.
Projection contrast sensitivity. The plot shows the projection contrast sensitivity (see description in text) for two observers as a function of grating spatial frequency for isochromatic (black), red/green isoluminant (red), and S-cone isolating gratings (blue). Values shown are the average of values obtained for gratings in sine and cosine spatial phase. Top panel, observer AP; bottom panel, observer BS.

