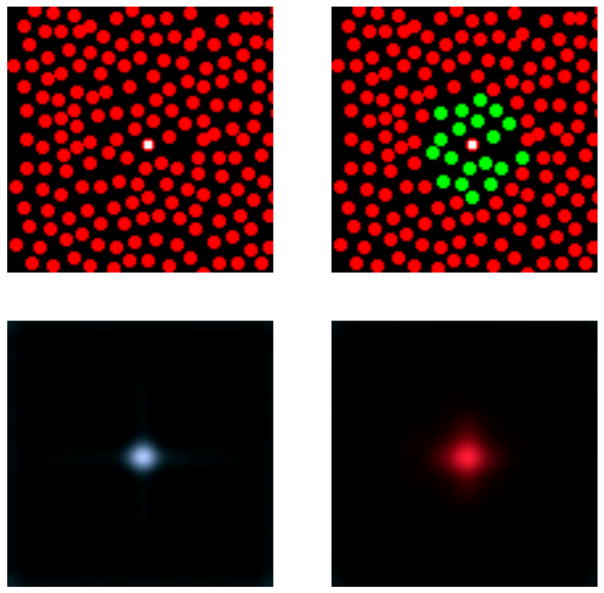
Figure 7.
Reconstruction algorithm performance for two artificial mosaics. The top two panels show two hypothetical mosaics. The left mosaic contains only L cones. The spatial arrangement of the cones in the second mosaic is the same, but here the central L cone has been surrounded by an island of M cones. We used the Bayesian algorithm to reconstruct the stimulus from the responses of these two mosaics, for the case where the only the central L cone (marked by the white square in each panel) had a non-zero response. That response represented a near threshold intensity level and was the same for both reconstructions. The reconstructed images are shown below each mosaic. Displayed reconstructions were obtained by mapping LMS planes to the standard sRGB color space (without gamma correction). To suppress ringing away from the central spot and make the color appearance at the center of the reconstructed spot easier to visualize, the reconstructed images shown were windowed at each pixel by the quantity and values less than 0 were set to 0. If we had not done this, the images would have had spatial structure similar to the basis images shown in Figure 6. Each displayed image was normalized by a single scale factor so that it occupied the full intensity range of the sRGB color space.

