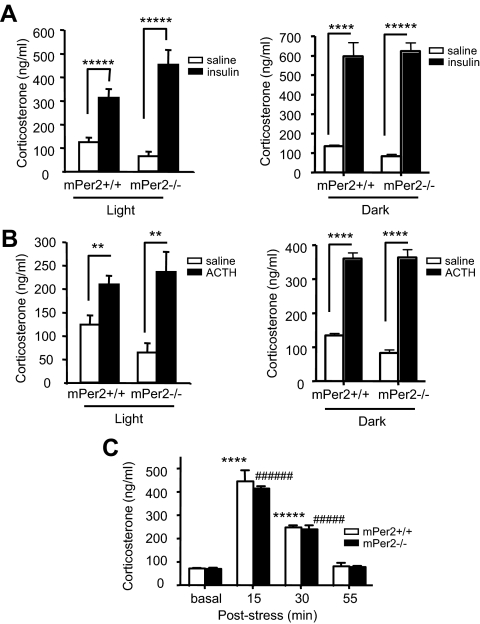
Figure 2.
mPer2−/− mice have intact glucocorticoid response to stress. A, Serum corticosterone level 60 min after saline (light period, n = 7–12 per genotype; dark period n = 4 per genotype) or insulin (0.75 mIU/g) (light period, n = 7–9 per genotype; dark period, n = 5 per genotype) injection. Results are mean ± sem. Single-factor ANOVA between saline and insulin during the light period: P = 0.0001, F = 23 (*****) for mPer2+/+ mice; and P = 7e-05, F = 35 (*****) for mPer2−/− mice. Single-factor ANOVA between saline and insulin during the dark period: P = 0.0007, F = 34 (****) for mPer2+/+ mice; and P = 2e-05, F = 109 (*****) for mPer2−/− mice. B, Serum corticosterone level 60 min after saline (light period, n = 7–12 per genotype; dark period n = 4 per genotype) or ACTH (10 μg/kg) injection (light period, n = 7–12 per genotype; dark period, n = 5 per genotype). Results are mean ± sem. Single-factor ANOVA between saline and ACTH during the light period: P = 0.005, F = 10 (**) for mPer2+/+ mice; and P = 0.004, F = 14 (**) for mPer2−/− mice. Single-factor ANOVA between saline and ACTH during the dark period: P = 1e-05, F = 123 (****) for mPer2+/+ mice; and P = 2e-05, F = 97 (****) for mPer2−/− mice. C, Time course of corticosterone response. Serum corticosterone levels were measured before, and 15, 30, and 55 min after 10 min restraint stress (n = 5 per genotype). Results are mean ± sem. Single-factor ANOVA between basal and post-stress for mPer2+/+ mice: P = 4e-05, F = 68 (****) at 15 min; and P = 1e-08, F = 535 (*****) at 30 min. Single-factor ANOVA between basal and post-stress for mPer2−/− mice: P = 1e-10, F = 1654 (######) at 15 min; and P = 3e-06, F = 131 (#####) at 30 min.

