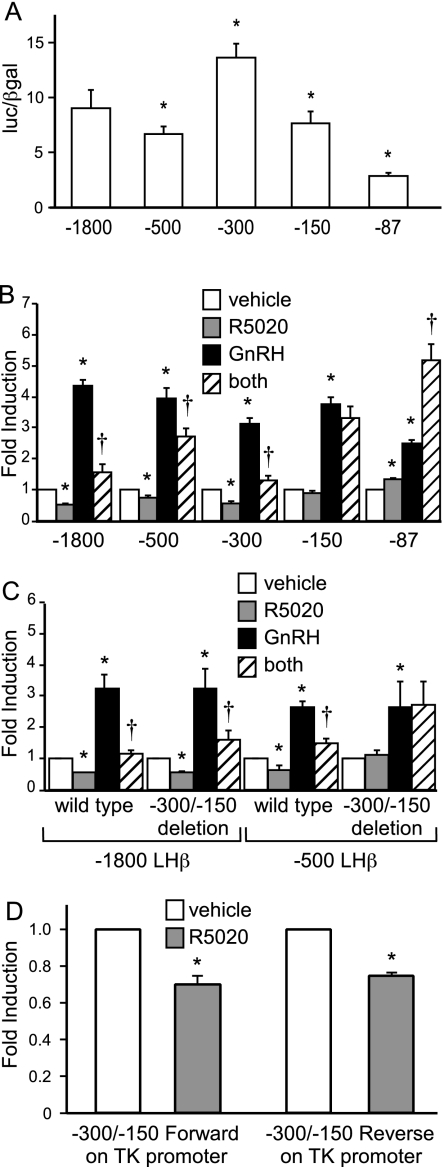
Figure 4.
Progesterone suppression of basal and GnRH-induced LHβ gene expression maps to the −300 to −150 region of the LHβ promoter. A, LβT2 cells were transiently transfected with either the −1800-bp LHβ-luc reporter plasmid or 5′ promoter truncations to compare basal transcriptional activity in the absence of hormone treatment. luc, Luciferase. B, LβT2 cells were transiently transfected with either the −1800-bp LHβ-luc reporter plasmid or 5′ promoter truncations to compare the effects of hormone treatments. C, LβT2 cells were transiently transfected with either −1800-bp or −500 LHβ-luc reporter plasmids or −1800-bp or −500 LHβ-luc reporter plasmids containing a 150-bp deletion of the region between −300/−150 of the LHβ promoter. D, Cells were transfected with a TK-luc reporter plasmid containing the −300/−150 repressive element in the forward or reverse orientation. After overnight starvation in serum-free media, the cells were treated with vehicle, 100 nm R5020, 10 nm GnRH, or both hormones as indicated (B–D). Luciferase activity was normalized to β-galactosidase activity and set relative to the empty reporter vector (A–C, pGL3; and D, TK-luc). Results represent the mean ± sem of at least three independent experiments performed in triplicate and are presented as luc/β-gal for basal gene expression (A) or fold induction of hormone treatment relative to the vehicle control (B–D). *, Significant differences from the vehicle-treated control; †, interaction as defined by a two-way ANOVA (P < 0.05).

