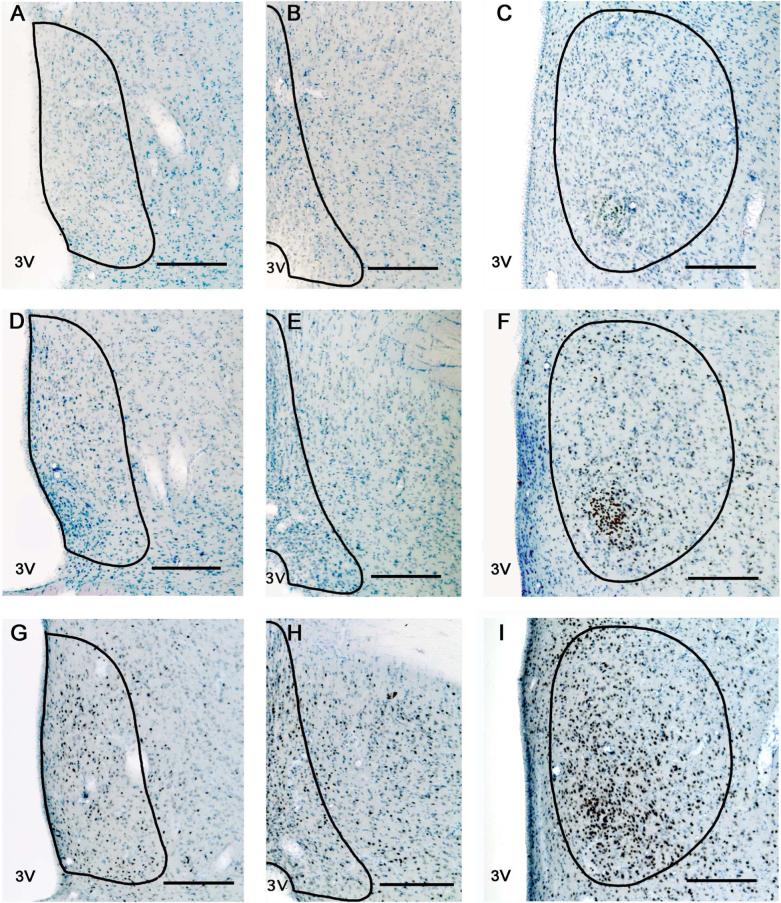
Figure 3. Photomicrographs of AR immunoreactivity in young, middle-aged and old rats.
Representative sections from a young (panels A, B, C) middle-aged (panels D, E, F) and old (panels G, H, I) male rat of the three brain regions [AVPV (left column), MePO (middle column) and MPN (right column)] are shown. The contours of the AVPV, MePO and MPN are drawn based on Nissl staining and according to Swanson's rat brain atlas (1998). Scale bar = 200 μm.

