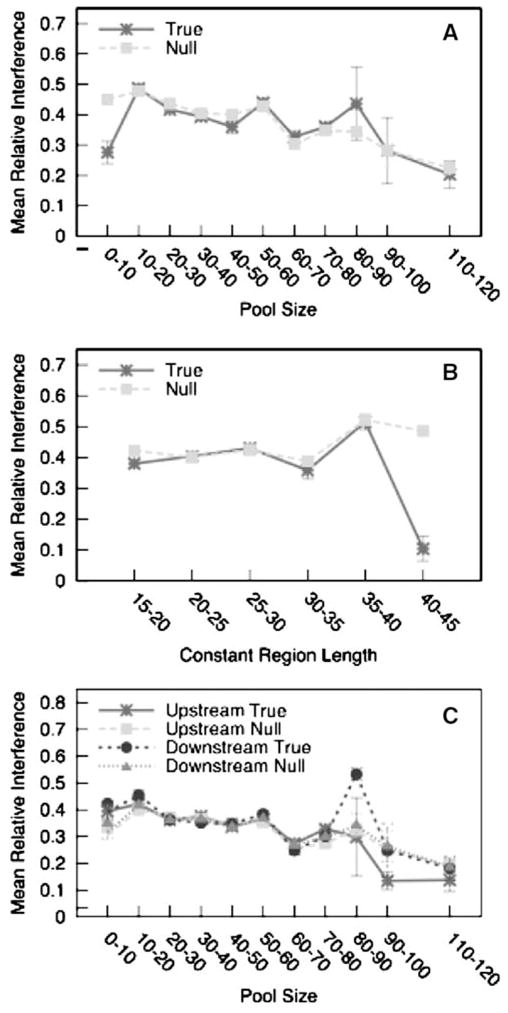
Fig. 3.

The relative interference caused by constant regions (A) over the range of pool sizes, (B) across the range of constant region sizes, and (C) by the individual constant regions. In (A) and (B), the dark lines (stars) show the interference caused by the true constant regions, whereas the light lines (squares) show the interference from randomized constant regions. In (C), the dark lines (stars, circles) depict the interference caused by the true constant regions, and the light lines (squares, triangles) depict interference caused by randomized constant regions. We normalized the distance to the length of the random region to facilitate comparison across the range of pool sizes. Error bars depict one standard error about the mean
