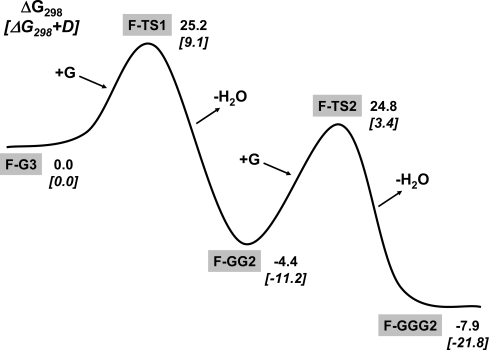
Figure 4.
Relative free energy profile (kcal mol−1) of the glycine condensation reactions shown in Figure 3. Bare values refer to pure ΔG298, italic values in brackets refer to ΔG298+D, including the Grimme’s dispersive correction. Relative free energies refer to the F-G3 + 2G reference state.

