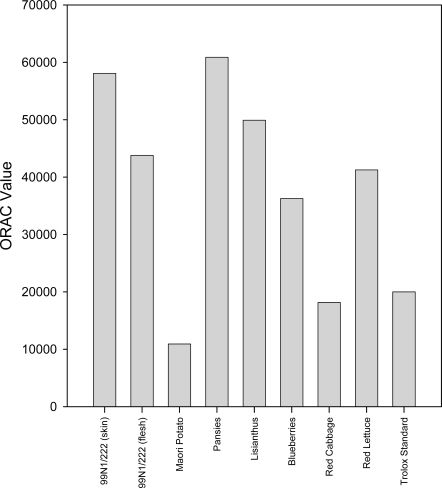
Figure 6.
Bar graph showing ORAC values for each extract from the ORAC assay. The ORAC values represent the efficiency of each extract to inhibit peroxyl radical oxidation, thus R-PE fluorescence, and were calculated from the average of duplicate S values derived from the measurement of fluorescence.

