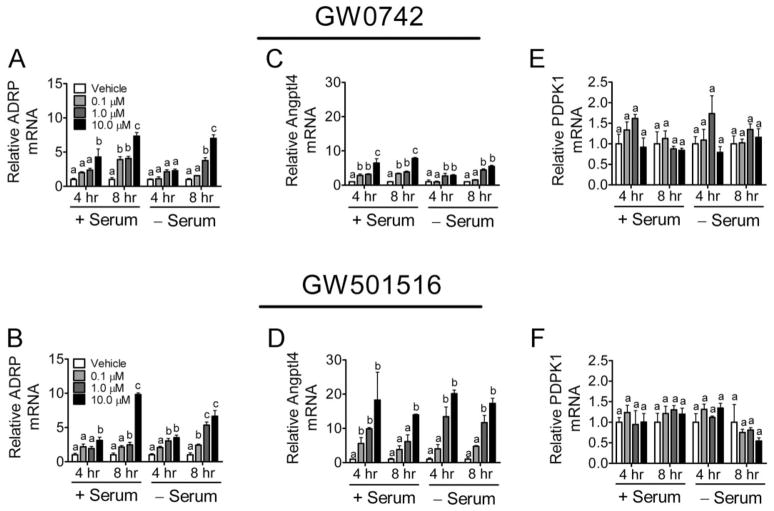
Fig. 2.
Modulation of gene expression by ligand activation of PPARβ/δ in HaCaT keratinocytes. HaCaT cells were treated for either 4 or 8 h with the indicated concentration of GW0742 (A, C, and E) or GW501516 (B, D, and F) in the presence or absence of serum. Quantitative real-time PCR was performed as described under Materials and Methods to examine the expression of mRNA encoding ADRP (A and B), Angptl4 (C and D), and PDPK1 (E and F) normalized to mRNA encoding GAPDH. Values are the average -fold change compared with control treatment and represent the mean ± S.E.M. Values with different letters are significantly different, P < 0.05, as determined by ANOVA and Bonferroni’s multiple comparison test.

