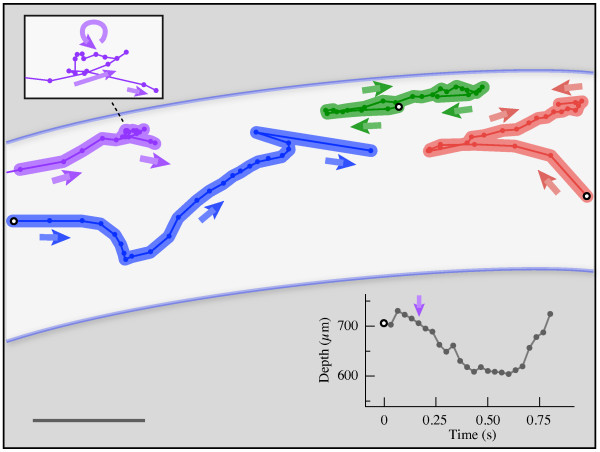
Figure 5.
Examples of non-uniform flow patterns in the heart of the grasshopper Schistocerca americana. This schematic depicts the paths of four bubbles digitized in one video sequence (duration, 0.83 s) moving within the heart (white background, 6th abdominal segment). Each color represents a different bubble. Time between points is 0.033 s; the start of the sequence is indicated with black and white circles. The overall motion of the flow is from left to right (anterograde; toward the head), but the microscale flow is non-uniform. For example, the red and green bubbles begin moving to the left while the blue bubble was moving to the right; these bubbles also reverse direction to the left at the end of their sequences. Note that the purple bubble displays a counterclockwise vortical movement (shown with greater detail, inset box). The corresponding movement of the pericardial sinus is depicted in the graph (lower right). Note that the purple bubble enters the frame from the left at t = 0.20 s, 5 frames later than the other bubbles. Scale bar, 200 μm.

