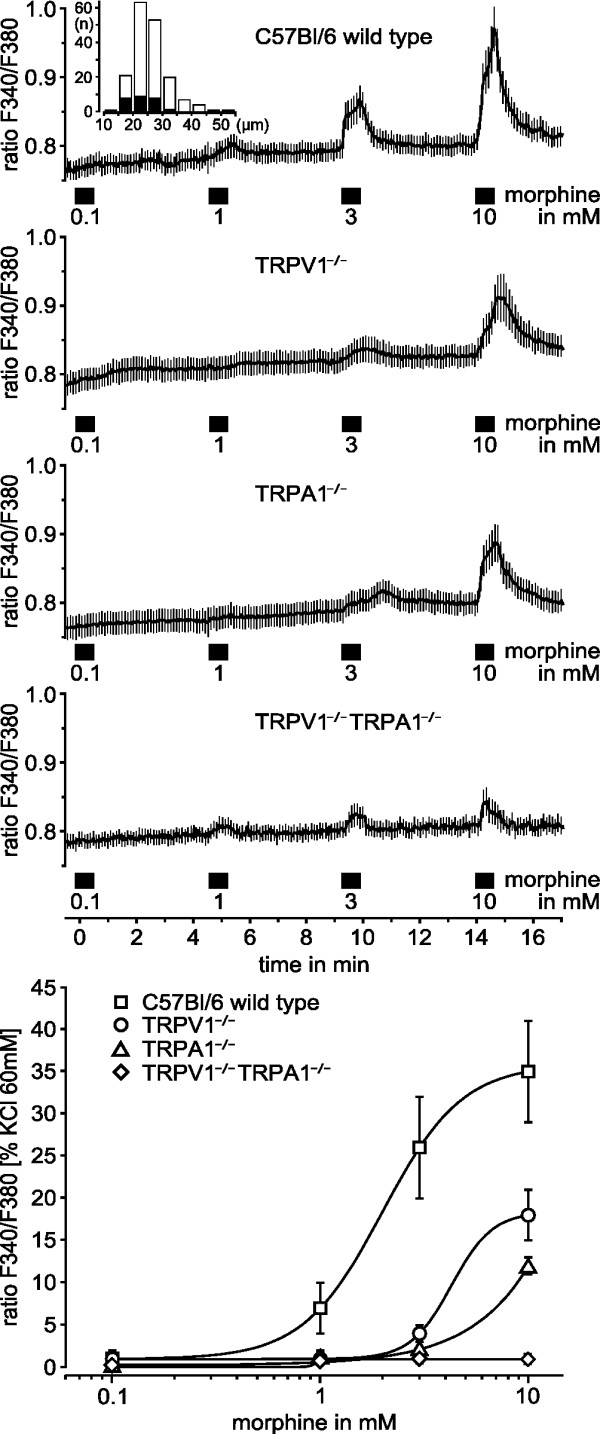
Figure 3.

Morphine dose-dependently activates DRG neurons via TRPA1 and TRPV1 receptors causing increases in intracellular calcium. Morphine application periods lasting 40 s are indicated by bars. The upper four panels show the fluorescence ratios of the four tested genotypes, presented as mean ± SEM of all neurons (number of neurons, C57Bl/6: 134, TRPV1-/-: 112, TRPA1-/-: 125 and TRPV1-/- TRPA1-/-: 135). All neurons responded to 60 mM KCl at the end of the experiment (not shown). The stacked histogram inset in the uppermost panel shows that preferentially small size DRG neurons respond to morphine (black bars, x: cell diameter in μm, y: number of cells). The bottom panel summarizes the dose-dependent activation. The integral of the fluorescence ratio during the application period was normalized to the response elicited by 60 mM KCl.
