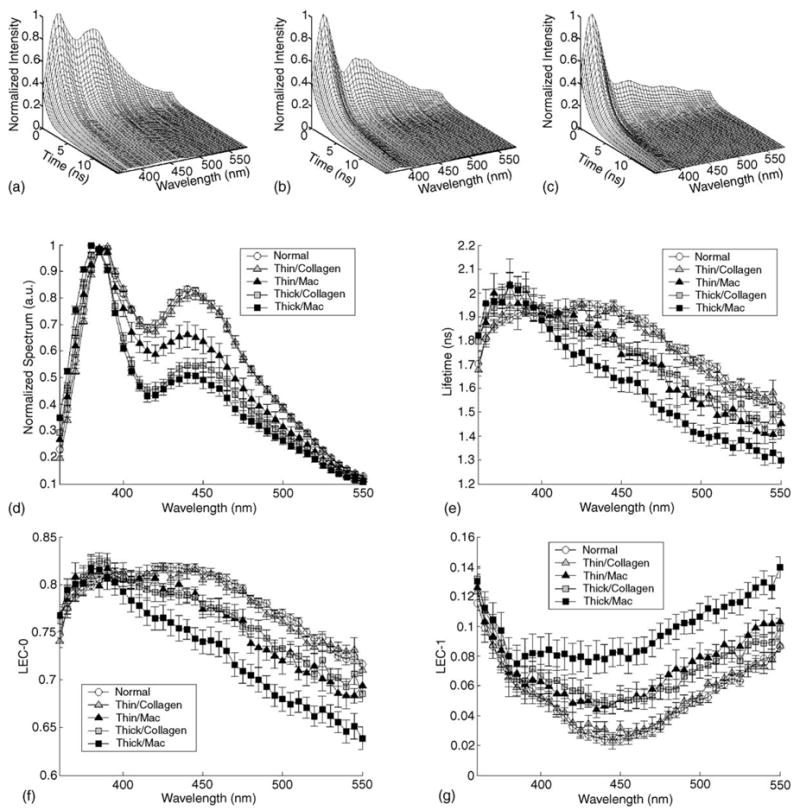
Fig. 3.

Representative time-resolved fluorescence spectra or IRF of the (a) N-Athero aortic wall, (b) Thick-Collagen lesions and (c) Thick-Mac lesions. Spectroscopic features retrieved from the IRFs of each tissue group: (d) normalized spectrum, (e) fluorescence lifetime (τf), (f) Laguerre coefficients of zero-order (LEC-0) and (g) Laguerre coefficients of first-order (LEC-1). Data are given as mean ± S.E.
