Fig. 4.

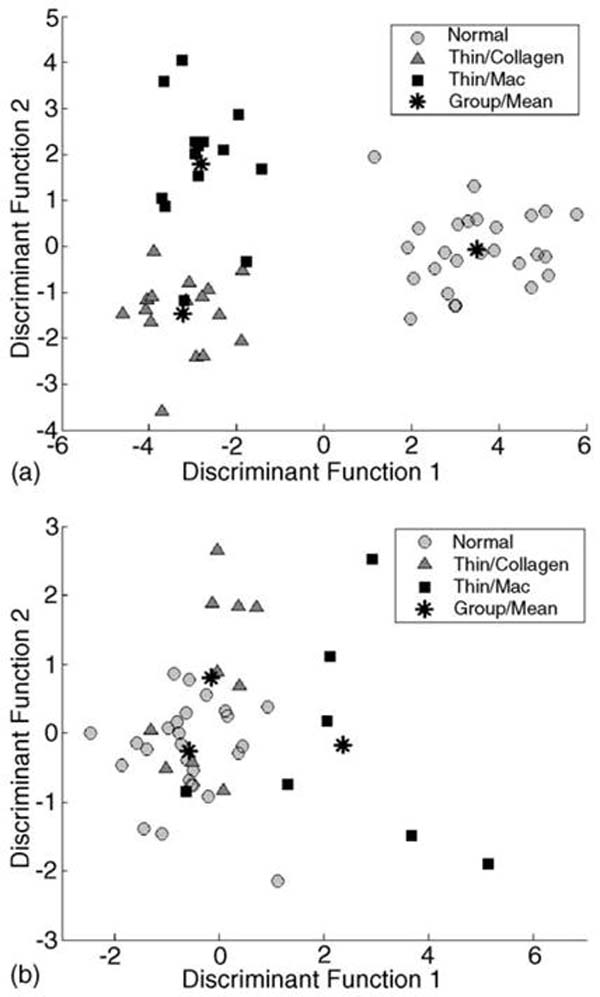
Results of the stepwise linear discriminant analysis. Scatterplot depicts the discriminant score of the each the three tissue sub-groups: (a) N-Athero vs. Thick-Collage vs. Thick-Mac and (b) N-Athero vs. Thin-Collagen vs. Thin-Mac.

Results of the stepwise linear discriminant analysis. Scatterplot depicts the discriminant score of the each the three tissue sub-groups: (a) N-Athero vs. Thick-Collage vs. Thick-Mac and (b) N-Athero vs. Thin-Collagen vs. Thin-Mac.