
Figure 6. Distribution of hASCs With Respect to Length Density Quartile.
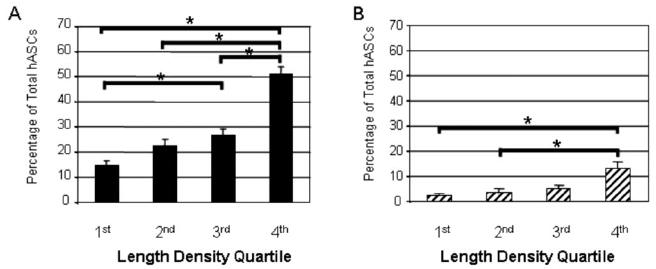
A) Percentage of total hASCs in the tissue that exhibit pericyte-like-morphologies at day 60, and B) percentage of total hASCs that exhibit pericyte-like morphologies and also express pericyte markers for each quartile of length density at day 60. Error bars represent standard error; * = significantly different (p≤0.05).