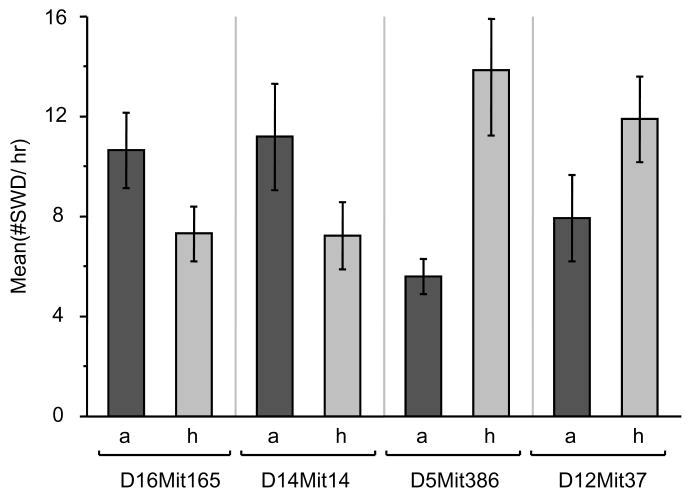
Figure 4. SWD effects for marker alleles with suggestive evidence or association in backcross mice.
The top of each bar represents mean ± S.E.M. The mean SWD/hr of homozygous alleles was larger than that of heterozygous alleles at D16Mit165 or D14Mit14. In contrast, the mean SWD/hr of homozygous alleles was smaller than that of heterozygous alleles at D5Mit386 or D12Mit37; a: C3H/HeOuJ homozygous alleles, h: heterozygous alleles. The number of animal (a, h) is: (33, 23) for D16Mit165, (29, 27) for D14Mit14, (31, 25) for D5Mit386 and (37, 19) for D12Mit37.

